
Ice Navigation in Canadian Waters
Chapter 3: Ice climatology and environmental conditions
Table of Contents
- Preface
- Chapter 1: Icebreaking and Shipping Support Services
- Chapter 2: Regulations and Guidelines
- Chapter 3: Ice Climatology and Environmental Conditions
- Chapter 4: Navigation In Ice Covered Waters
- Chapter 5: Vessel Design and Construction for Ice Operations
- Annex I: Terminology for Ice, Navigation and Vessel Design
- Annex II: Reference Material
Chapter 3: Ice climatology and environmental conditions
3.1 Environmental conditions
This chapter provides an overview of environmental conditions that can be expected in areas of Canada where navigation in ice occurs. The chapter includes a summary of important meteorological and oceanographic features of the marine environment, a description of basic ice properties, a review of ice conditions that may be encountered in different regions of Canada and information on icebergs. Resources can be found on the ECCC Environment and natural resources website.
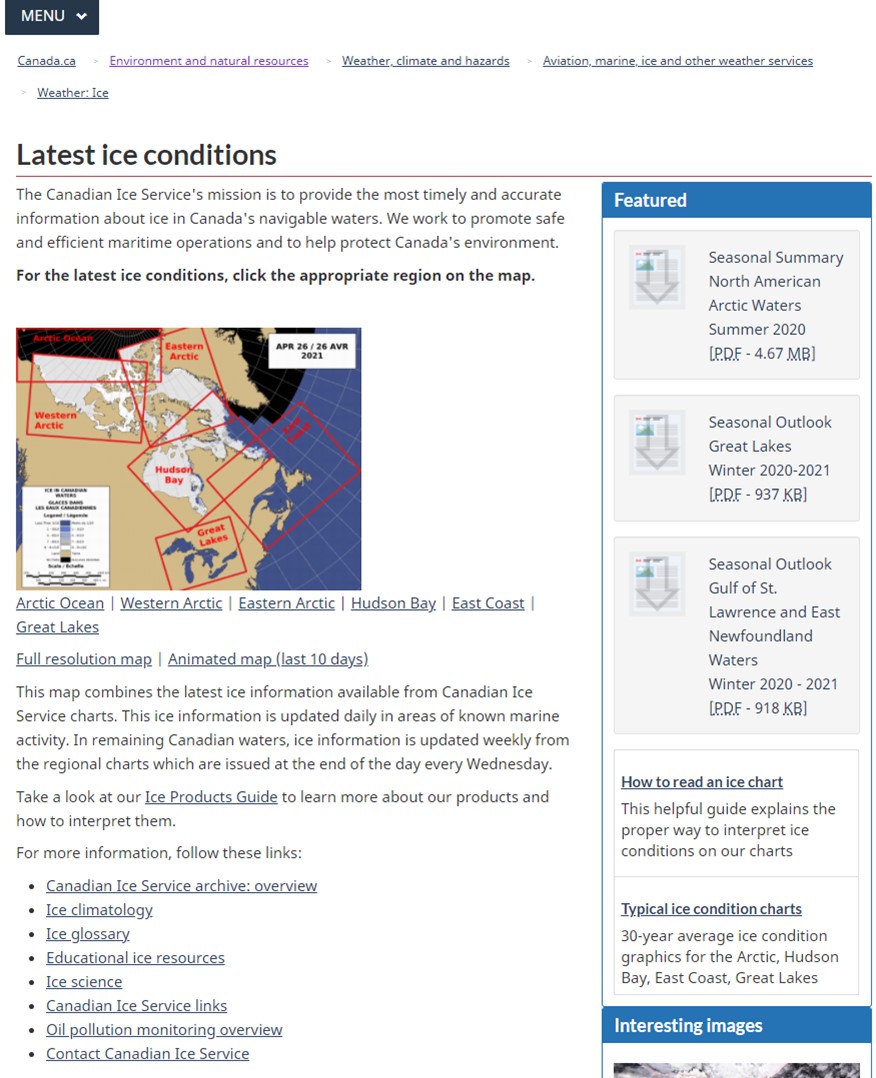
Figure 12 - Canadian Ice Service website
Text version: Canadian Ice Service website
The figure shows the Canadian Ice Service Internet page of the Latest ice conditions. The menu identifies the path to that page in the following order: Canada.ca / Environment and natural resources / Weather, climate and hazards / Aviation, marine, ice and other weather services / Weather: Ice.
Under “Weather: Ice” the latest ice conditions are introduced with this statement:
The Canadian Ice Service's mission is to provide the most timely and accurate information about ice in Canada's navigable waters. We work to promote safe and efficient maritime operations and to help protect Canada's environment.
For the latest ice conditions, click the appropriate region on the map.
The map entitled “Ice in Canadian Waters” shows a rough monochrome view of Canadian territory with red rectangular sections that are template areas which charts are based upon. The Arctic Ocean, Western Arctic, Eastern Arctic, Hudson Bay, East Coast and Great Lakes.
The map's legend describes the waters being coloured in the following narrative:
- Dark blue - Less than 1/10 of ice
- Royal Blue - 1-3/10
- Light Blue - 4-6/10
- Grey - 7-8/10
- White - 9-9+/10
- Brown - Land
- Black - No data
A scale is provided for increments of 200km up to 1000km and is converted into nautical miles as well.
Following links are for a Full resolution map or Animated map (last 10 days).
This map combines the latest ice information available from Canadian Ice Service charts. This ice information is updated daily in areas of known marine activity. In remaining Canadian waters, ice information is updated weekly from the regional charts which are issued at the end of the day every Wednesday.
Take a look at our Ice Products Guide to learn more about our products and how to interpret them.
For more information, follow these links:
- Canadian Ice Service archive: overview
- Ice climatology
- Ice glossary
- Educational ice resources
- Ice science
- Canadian Ice Service links
- Oil pollution monitoring overview
- Contact Canadian Ice Service
The figure has boxes on the right that mentions what is featured:
- Seasonal Summary North American Arctic Waters, Summer 2020 (pdf file 4.67Mb)
- Seasonal Outlook Great Lakes, Winter 2020-21 (pdf file 937Kb)
- Seasonal Outlook Gulf of St. Lawrence and East Newfoundland Waters, Winter 2020-21 (pdf file 918Kb)
- How to read an ice chart: This helpful guide explains the proper way to interpret ice conditions on our charts
- Typical ice condition charts: 30-year average ice condition graphics for the Arctic, Hudson Bay, East Coast, Great Lakes.
- Interesting images (satellite imagery in example)
The climatology of Canadian ice-covered waters varies widely, as the weather and ocean conditions influencing climate differ, from the Great Lakes and St. Lawrence River in the south to the waterways between the Arctic Islands in the north. Environmental considerations are also diverse. It is only possible to highlight key aspects here.
Seasonal Outlook - North American Arctic Watersis published annually by CIS. This publication incorporates the output of ice reconnaissance, analysis, and forecasting. It is issued in early June and is useful for planning voyages to all waters north of Labrador. Seasonal Outlooks - Great Lakesare issued in early December, to provide a similar overview of expected winter ice conditions in southern areas. Seasonal outlooks are updated twice monthly during the ice-navigation season, providing 30-day ice forecasts. This information is available on ECCC Latest ice conditions.
3.1.1 Air temperature patterns
Formation and growth of sea ice depends on the air temperature falling below freezing (0 °C) and subsequent lowering of sea surface temperatures. Figure 13 illustrates the average dates when the average daily air temperatures fall below 0 °C. Figure 14 shows the dates when the average air temperatures rise above 0 °C. The differences in these dates, from one part of Canada to the next, provide an indication of how widely the duration of cold temperatures may vary in Canada.
Sea-ice growth usually starts sometime after freezing air temperatures are achieved because the freezing point for sea water is near -1.8 °C. In addition, warmer water from within the ocean may reduce the effect of freezing air temperatures on the surface water, further delaying ice growth.
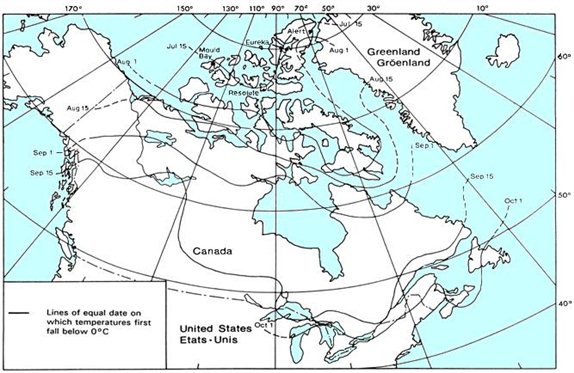
Figure 13 - Dates when the mean daily temperature falls below 0 °C
Text version: Dates when the mean daily temperature falls below 0 °C
A general map of Canada and its neighbours identifying average broad lines of equal dates on which the mean daily temperatures first fall below 0 degrees Celcius.
- Top line: Alert, Resolute to Mould Bay: 15 July.
- 2nd line: High Greenland, lower Baffin Island, upper Victoria Island to Beaufort Sea: 1 August.
- 3rd line: Middle Greenland, Hudson Strait, upper Northwest Territories to Alaska: 15 August.
- 4th line: Northern Quebec, Hudson Bay, middle Northwest Territories to Yukon: 1 September.
- 5th line: Labrador, lower Quebec, Lake Superior to Northern of Prairies: 15 September.
- 6th line: Newfoundland, East Coast provinces, to Great Lakes: 1 October.
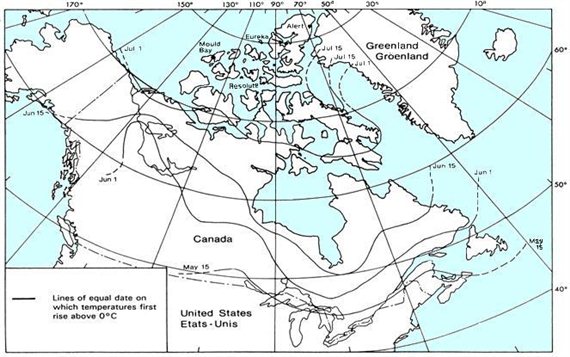
Figure 14 - Dates when the mean daily temperature rises above 0 °C
Text version: Dates when the mean daily temperature rises above 0 °C
A general map of Canada and its neighbours identifying average broad lines of equal dates on which the mean daily temperatures first rise below 0 degrees Celcius.
- Top line: Baffin Bay: 15 July.
- 2nd line: Davis Strait, Coronation Gulf to Northern Alaskan coast: 1 July.
- 3rd line: Middle Labrador-Quebec, Northwest Territories to lower Alaska: 15 June.
- 4th line: Belle Isle Strait, Prairies to Mackenzie River: 1 June.
- 5th line: East Coast provinces, Great Lakes to lower Prairies: 15 May.
3.1.2 Major storm tracks and wind conditions
Weather systems tend to move from west to east across Canada. Major storm tracks during the summer months are shown in figure 15. Storms tend to pass through the St. Lawrence then move out to sea over the Grand Banks of Newfoundland and the Labrador Sea. Some storm systems track northward toward the southern tip of Greenland then into Davis Strait. These storms tend to produce severe weather conditions.
Storms in the Arctic also tend to follow specific tracks, particularly south of Parry Channel; storms follow a general west to east track. Figure 16 shows major winter storm tracks. The important weather features affecting the North Atlantic during winter are a low pressure area, the Icelandic Low, centred southeast of Greenland; and a continental high pressure system which develops west of Hudson Bay.
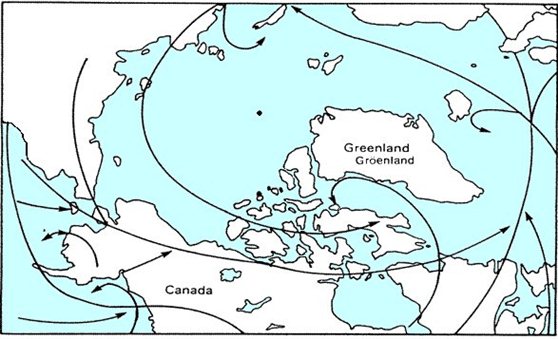
Figure 15 - Principal storm tracks in summer in Canadian Arctic
Text version: Principal storm tracks in summer in Canadian Arctic
A broad view of the international Arctic principal storm tracks (vectors) in summer relative to Canadian territory. The vectors mostly follow the westerlies winds trend mixed with polar weather currents and the Coriolis effect caused in the North Hemisphere.

Figure 16 - Principal storm tracks in winter in the Canadian Arctic
Text version: Principal storm tracks in winter in the Canadian Arctic
A broad view of the international Arctic principal storm tracks (vectors) in winter relative to Canadian territory. The vectors mostly follow the westerlies winds trend mixed with polar weather currents and the Coriolis effect caused in the North Hemisphere.
3.1.3 Polar lows
Polar lows are small, intense low-pressure events that may not be detected or predicted by meteorologists. The first indication of a polar low may be a sudden change in pressure, rapid increase in wind, or heavy snow flurries at a vessel or station.
Polar lows form near the ice edge or coast where very cold air flows from ice or land surfaces over open water, which is warm relative to the air temperature. The cold air warms, rises, the pressure falls, a circulation evolves and, depending on other supportive factors such as cooling aloft, the polar low deepens or weakens. Polar lows usually occur during the fall, winter, and early spring.
Polar lows are often accompanied by strong winds, rapid drop in air pressure and moderate to heavy snow. A polar low can form quickly and seldom lasts more than a day. However, under stagnant weather systems, polar lows or a family of polar lows can persist for several days.
3.1.4 Precipitation
Precipitation patterns vary considerably between southern Canada and the Arctic islands. Rain and snow may be of concern to shipboard activities in Spring and Fall, when rain combined with low temperatures can result in vessel icing.
An important factor in determining precipitation amounts is the availability of moisture sources. In the high Arctic, water available for precipitation is generally low. However, areas of relatively high amounts of available water are found around southern Baffin Island in Davis Strait and in the Amundsen Gulf-Victoria Island area. The northern and central parts of the Arctic have lower moisture availability that is reflected in lower rain and snowfall in these areas.
3.1.5 Fog and visibility
Marine visibility is affected by a number of factors including daylight hours, precipitation, blowing snow, and fog. The number of daylight hours available for navigation becomes a particular concern the further north one travels. In the Arctic, extended daylight conditions occur through the summer, whereas the opposite is true during the winter months. Figure 17 illustrates the seasonal variability of daylight for different latitudes.
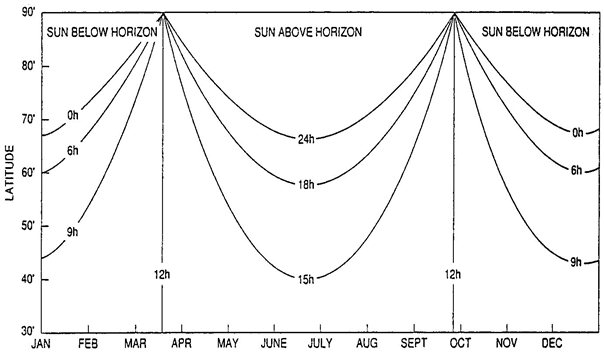
Figure 17 - Seasonal Variability of Daylight by Latitude and Month
Text version: Seasonal Variability of Daylight by Latitude and Month
A graphic representation of the seasonal variability of daylight time in hours, in relation to latitudes and months. The sun being above or below the Earth's horizon.
The graphic horizontal axis covers all the months of the year while to vertical axis covers latitudes between 30 and 90 degrees North. Each month period we can identify the number of hours (0, 6, 9 or 12) that the sun is below the horizon providing or not sunsets and sunrises between both equinoxes (late September to late March). Also, it identifies the number of hours (24, 18, 15 or 12) that the sun is above the horizon again providing or not sunsets and sunrises between both solstices (late March to late September).
Fog is a major cause of low visibility at sea. It is particularly common in Baffin Bay in the spring and summer and on the Grand Banks at all times of the year. Sea fog, or advection fog, forms when warm, moist air moves over colder seawater. As the air cools below its saturation point, excess moisture condenses to form fog. This type of fog may cover large areas and may persist for long periods, even under windy conditions, provided a continuous supply of warm moist air is available.
A second type of fog, sea smoke, or evaporation fog, forms when cold air moves over warmer seawater. In this case moisture evaporates from the sea surface and saturates the air. As the air is cold, excess moisture condenses to form fog. During the summer, fog often will develop over an ice pack or ice-covered waters. It is believed that this type of fog forms when melt-water on the ice surface warms, saturates the air, and condenses to produce fog.
Blowing snow is an important contributor to reduced visibility during winter months. In addition to wind strength, the time since the last snowfall affects the amount and duration of the blowing snow. Snow compacts over time and, as a result, the longer the interval between snowfalls and a strong wind event, the less likelihood there will be of significant amounts of blowing snow.
3.1.6 Freezing spray and superstructure icing conditions
Vessels operating in Canadian waters in late fall and winter are likely to experience some degree of topside icing on decks, bulwarks, rails, rigging, and spars. Icing can hinder shipboard activity and, in extreme cases, it can seriously impair vessel operations and stability. The accumulation of ice on a ship's superstructure can raise the centre of gravity, lower the speed and cause difficulty in manoeuvring. Icing can also create various problems with cargo handling equipment, hatches, anchors, winches, and the windlass. Smaller vessels are most at risk, and several fishing vessels have been lost off the Canadian east coast because of spray icing.
Icing on vessels can result from freshwater moisture such as fog, freezing rain, drizzle, and wet snow, or from salt-water including freezing spray and wave wash. Icing from advection and evaporation fog can be a problem in the fall months, but occurs rarely in winter as moisture sources are minimal once an ice cover forms. Icing arising from precipitation can occur when there is an accompanying drop in air temperature, but its occurrence is generally limited to the spring and fall months. In the Arctic, it is an infrequent phenomenon, with most areas experiencing less than 25 hours annually. Areas such as western Baffin Bay, Davis Strait, and Amundsen Gulf near Cape Parry experience 25 to 50 hours of icing annually, whereas off Brevoort and Resolution Islands icing may occur for as many as 100 hours each year.
Of the various forms of superstructure icing, freezing spray is the most common, and is the most severe cause of ice build-up. It can occur whenever the air temperature falls below the freezing temperature of seawater and when sea surface temperatures are below 6 °C. To get spray icing there must be a source of spray and enough cooling from the atmosphere so that spray freezes to an object before it has had time to run off. Freezing spray can be experienced in almost all Canadian waters, although it is more frequent and more severe in coastal waters off eastern Canada. Ice accretion rates from freezing spray can exceed 2 centimetres per hour and ice build-up of over 25 centimetres is not uncommon.
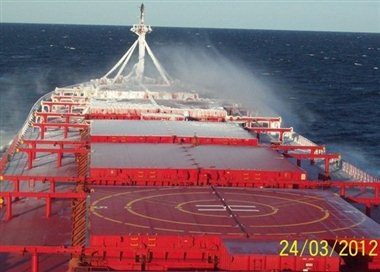
Figure 18 - Freezing Spray
In addition to air temperature and wind speed, other factors affecting freezing spray accumulation are the particular vessel characteristics including size and shape of deck fittings. Smaller vessels are exposed to more spray, and lose stability more rapidly than larger vessels. Finally, it is important to note that the presence of sea or lake ice will reduce wave generation and the potential for freezing spray. As a general rule, it can be assumed that freezing spray will not be a problem once the ice cover exceeds 6/10 concentration. Once vessels are in the ice, the potential for freezing spray is virtually zero. The preceding paragraphs describe the general process of superstructure icing, but variations in spraying and heat loss over the vessel can result in significant variations in ice accumulation rates, depending on elevation and exposure of a shipboard object. For instance, ice accumulates more rapidly on rigging and spars, increasing the potential for a vessel to capsize.
Freezing spray warnings are included in marine forecasts by ECCC. However, it is difficult to provide accurate icing forecasts as individual vessel characteristics have a significant effect on icing. Graphs assessing the rate of icing based on air temperature, wind speed, and sea-surface temperature can provide a guide to possible icing conditions, but should not be relied on to predict ice accumulation rates on a vessel. Caution should be exercised whenever gale-force winds are expected in combination with air temperatures below -2 °C.
Specific regional information concerning vessel icing is given below for the Gulf of St. Lawrence, the Labrador Sea and Hudson Bay, and Arctic waters including Baffin Bay and Davis Strait.
3.1.6.1 Gulf of St. Lawrence
In the Gulf of St. Lawrence, freezing spray is the most frequently reported cause of vessel icing. Freezing spray is also responsible for the heaviest ice accumulations, which can exceed 25 centimetres in thickness. Freezing precipitation and super-cooled fog are less frequently reported and are typically responsible for accretions of 1-2 cm thick.
Spray icing can be encountered in the Gulf area any time from November to April, although it is most frequently reported from December to February. During the month of January, potential spray icing conditions are encountered more than 50% of the time. Freezing rain is most frequently experienced from December to April, and super-cooled fog is reported from January to March.
Freezing spray conditions in the Gulf are usually produced by intense winter storms situated off the Canadian east coast. These storms set up a strong northwesterly flow of cold arctic air over the Gulf area which produces snow showers and squalls over open water. During spray icing events, the air temperature is typically around -10 °C with 30-knot northwesterly winds and 2 to 3 metre waves. Spray icing potential would be greater in the Gulf area were it not for short fetches and the presence of extensive ice cover which limit wave generation.
From an investigation of icing thickness reports in the Gulf, 3 areas showed heavier icing accumulations: the central Gulf area west of the Magdalen Islands; the Strait of Belle Isle off Flowers Cove; and north of the Gaspé Peninsula off Cap de la Madeleine. These heavier accumulations may result from more intense local icing conditions (such as shorter, steeper waves) or because the areas are visited by vessels more susceptible to spraying and consequently to icing.
3.1.6.2 Labrador Sea and Hudson Bay
In the Labrador Sea and Hudson Bay, the main cause of vessel icing is freezing spray. Freezing spray is also responsible for the heaviest ice accretions, which can exceed 20 centimetres. Icing from super-cooled fog and freezing precipitation are less frequently reported, and are generally responsible for small amounts of accreted ice, about 1-2 centimetres. Arctic sea smoke can accompany spray icing if air temperatures are very cold: vessel icing reports from east coast waters show that combined spray and fog icing conditions are more frequently experienced in the Labrador Sea.
The potential for spray icing exists from October to May in both areas. However, this is modified in Hudson Bay by the heavy ice cover which restricts vessel speed and wave growth for most of the winter. Spray icing is, therefore, most frequently encountered in October and November when temperatures are dropping, but before the ice cover has advanced significantly. In contrast, spray icing can be encountered throughout the winter off the Labrador coast, where conditions leading to spray icing exist more than 30% of the time in January and February.
In Hudson Strait and Hudson Bay, freezing precipitation is most likely in the spring and fall, whereas in the Labrador Sea, freezing precipitation is experienced over the entire winter period. Super-cooled fog is most frequently reported in February and March in the Labrador Sea, and in the fall for Hudson Bay. It should be noted that it is very difficult to obtain information about the winter marine climate of Hudson Bay because there are very few vessel reports.
Freezing spray conditions are usually produced by large, intense cyclones centred to the northeast of each area. These storms set up strong west-northwest flows of cold arctic air, which produce snow showers and squalls over open water. During spray events in the Labrador Sea, the air temperature is typically -10 °C with 30-knot westerly winds, and 4 to 5 metre waves. Typical conditions are less severe in Hudson Bay, with an air temperature of -6 °C, 25-knot northwesterly winds and 2 to 3 metre waves.
Because icing events in the Labrador Sea are most frequently associated with westerly winds, conditions can appear deceptively sheltered near shore. The danger here is that if small coastal vessels venture out in these conditions, severe icing may be encountered offshore.
From an investigation of icing thickness reports in the Labrador Sea, one area showed noticeably heavier ice accumulations: average accretion thicknesses exceed 10 centimetre on Hamilton Bank (54°N, 55°W), whereas they are typically 4-5 centimetre elsewhere. These heavier accumulations may result from more intense local icing conditions (for example shorter, steeper waves), or because this area is visited by vessels more susceptible to spraying and consequently to icing.
3.1.6.3 Arctic waters
Generally, freezing spray is less of a problem in the Arctic than in the Gulf of St. Lawrence or the southern Labrador Sea, but the likelihood of marine icing incidents is at its greatest potential (over 20% of the time) during the fall. This is the period when the air temperatures are significantly below zero and open water is still prevalent in Baffin Bay, Davis Strait and the northern portions of the Labrador Sea. Although it occurs less frequently, incidents of freezing spray in the western Arctic and Beaufort Sea have been reported, with extreme cases of ice accumulation exceeding 15 centimetres.
3.2 Ice physics
This section describes some key elements of the physical properties of ice. The intent is to provide information that will help in the interpretation of both regional ice conditions and ice charts, and that will be useful in subsequent discussions of ice navigation practices.
3.2.1 Ice terminology
The terminology used in this manual is that used by mariners and scientists who deal with ice regularly. A list of Ice Terminology is provided in Annex I. These definitions have been developed and approved by the World Meteorological Organization. For more complete information on ice terminology, refer to the MANICE.
3.2.2 Ice types
Different forms of ice can be distinguished on the basis of their place of origin and stage of development. The principal kinds of floating ice are:
- lake and river ice, formed from the freezing of fresh water
- sea ice, formed from the freezing of sea-water
- glacier ice, formed on land or as an ice shelf from the accumulation and re-crystallization of snow
Types of lake ice are identified as being new, thin, medium, thick, or very thick, on the basis of their stage of development. New lake ice is recently formed and is less than 5 centimetres thick. Thin, medium, and thick lake ice range in thickness from 5-15 centimetres, 15-30 centimetres, and 30-70 centimetres, respectively, whereas very thick lake ice is greater than 70 centimetres in thickness.
Sea ice is categorized as new ice, young ice, first-year ice, and old ice. Within each of these categories there are terms referring to more specific types of ice. Details concerning more specific ice types can be found in Annex I. New ice is recently formed and composed of ice crystals which are only weakly frozen together and as the ice develops it forms a thin elastic crust over the ocean surface (nilas). Young ice represents a transition stage between nilas and first-year ice. Young ice ranges in thickness from 10-30 centimetres and, as it thickens, grows progressively lighter in colour from grey to grey-white. First-year ice is ice of not more than 1 winter's growth, ranging from 30 centimetres to over 2 metres thick. Old ice is sea ice that has survived at least one summer's melt. It is thicker and less dense than first-year ice and generally has smoother or rounder surface features. It can be divided into second-year or multi-year ice if the history of the ice is known.
Finally, sea ice is distinguished on the basis of its mobility. Fast ice is more or less fixed to the coast. It may move slightly in response to tides but, over the course of the winter, shows little lateral motion. On the other hand, pack ice or drift ice (a mass of individual ice pieces known as floes), is mobile, drifting in response to winds and current forcing. The dynamics of pack ice may result in the ice being put under pressure, frequently leading to deformation of the ice cover. Both the pressure itself and the deformed ice can affect vessel navigation.
Glacier or ice of land origin includes icebergs and ice islands. Icebergs are further typed by size and shape, with growlers (length less than 5 metres) and bergy bits (length 5 to 15 metres) representing the smallest iceberg pieces. Larger icebergs range from small (5 to 15 metres above sea level and 15 to 60 metres in length) to very large (higher than 75 metres and longer than 200 metres). According to shape, icebergs are frequently described as being tabular, domed, pinnacled, wedged, drydocked, or blocky.
3.2.3 Ice properties
The structure of an initial ice cover is dependent on weather and sea-state conditions at the time of ice formation. Under calm conditions, large ice crystals form at the surface and gradually interlock. This layer may be as little as 1 to 2 centimetres in thickness. In more turbulent conditions, ice crystals in the surface layer will tend to be smaller, and may form quite a deep layer, for instance, up to 3 metres thick off the Alaskan coast.
Once an initial layer of ice has formed on the surface, ice growth continues downward. Beneath a transition zone the ice is composed primarily of long columnar ice crystals. As the ice grows downward, brine is frozen into the ice crystals, but through the winter the brine solution gradually drains downward with the result that, at a given level in the ice, the salinity will change as the ice cover thickens.
During the summer season, surface melt-water drains through the ice, helping to flush out additional brine from the ice. Ice which survives more than one year takes on a layered structure and horizontal layers represent ice growth during successive years.
In addition to the fact that old ice tends to be thicker than first-year ice, its lower salinity is an important consideration for ice navigation, as ice strength is closely related to brine volume. With lower salinities, old ice is much stronger than first-year ice.
Warning: Old ice is harder, stronger, and usually thicker than first-year ice. Contact with old ice should be avoided whenever possible.
3.2.4 Ice formation and growth
Several forms of ice may be encountered such as: sea ice, lake ice, river ice, icebergs, and ice islands. The freezing of fresh- and salt-water does not occur in the same manner and the following brief explanation is limited to the formation of sea ice from salt-water.
When considering the freezing process, dissolved salts are important not only because they lower the water's freezing temperature (typically around -1.8 °C for sea water of 35 parts per thousand salt), but also because they affect the density of water. The loss of heat from a body of water takes place principally from its surface to the surrounding air or water. As the surface water cools, it becomes more dense and sinks, to be replaced by warmer, less dense water from below. The cycle repeats until the water temperature reaches its freezing point. This process takes longer as the amount of salt in the water increases. As a result, the onset of ice formation will be delayed.
The first visual indication of ice formation is the appearance of spicules or plates of ice in the top few centimetres of water. These spicules are also known as frazil ice and give the sea surface an oily appearance. As cooling continues, the ice crystals grow together to form grease ice, which gives the sea surface a matt or dull appearance. Eventually, sheets of ice rind or nilas are formed, depending on the rate of cooling and on the salinity of the water. Wind and waves frequently break the ice into smaller pieces which soon become rounded as they collide with each other. The resultant ice is termed pancake ice. Individual pancakes may later freeze together, gradually thickening from below as additional sea-water cools and freezes.
The rate of freezing is controlled by the severity and duration of cold air temperatures. At ‑30° to ‑40 °C, grey ice can form from open water in 24 hours. However, the thickening ice also acts as an insulator against the cold air, and the growth rate gradually diminishes. Even at these low temperatures, it would take a month for the ice to reach the thin first-year stage. Snow cover, which has approximately 10 times greater insulating value than sea ice, will also contribute to lower growth rates.
Sometimes the amount of snow cover may be so great that its weight depresses the underlying ice to the point that its surface is below the water level. The lowest layers of the snow cover may then become waterlogged and freeze, adding to the ice thickness. This happens often on the Great Lakes and the lower St. Lawrence River.
During the initial ice formation process, as ice crystals form and existing ones grow larger, brine becomes trapped in small cells within the ice matrix. The amount of brine trapped in the ice depends on the rate at which ice forms, with greater amounts of brine retained when ice formation is rapid. Slow ice growth allows a large portion of the brine to drain away. The amount of brine in the ice has an important bearing on its strength: the greater the brine content, the weaker the ice.
A second factor affecting the strength of ice is its age. As air temperatures warm and the ice approaches its melting point, entrapped brine begins to drain away, lowering the overall salinity of the ice cover. Should temperatures drop back below the freezing point before the ice melts entirely, it will re-freeze as purer and stronger ice. For this reason, ice more than 1 year old will be stronger than first-year ice for a given thickness and temperature, an important factor to consider when navigating in regions where old ice may be found.
3.2.5 Ice motion, pressure, and deformation
Ice normally forms near coasts first and then develops seaward. A band of fairly level ice becomes fast to the coastline and is held immobile. The seaward extent of fast ice formation will be limited by factors which can contribute a stable anchor for the ice. As an example, more fast ice would be expected in shallow coastal areas, or ones with numerous islands, than in areas where water depths drop sharply from the coast. Beyond this fast ice lies the pack or drift ice, which is free to move in response to wind and water forcing.
An area of newly formed ice seldom remains unaltered for long. Winds, currents, tides, and thermal forces cause the ice to undergo various forms of deformation. Wind causes ice floes to move generally downwind at a rate that varies with wind speed, concentration of the pack ice, and the extent of ice ridging or other surface roughness. A rule of thumb which is often used to estimate pack ice motion is that the ice will move at 30° to the right of the wind direction at about 2% of the wind speed.
One effect the wind has when it blows from the open sea onto floating ice is to compact the floes into higher concentrations along the ice edge, producing a relatively well-defined boundary between ice and open water. When winds blow off the ice toward the sea, the floes near the ice edge will be dispersed, resulting in lower ice concentrations and a diffuse ice/water boundary. As sea ice is partially submerged in the sea, it will also move in response to near surface currents and tides. As a result, the net movement of the ice is a complex product of both wind and water forces and consequently is difficult to forecast.
Thermal forces cause ice deformation: as temperatures drop, ice expands. For a drop in ice temperature from -2° to -3 °C, ice with a salinity of 10 parts per thousand will expand 0.3 metre for every 120 metres of ice floe diameter. At the same temperatures, for ice with a salinity of 4 parts per thousand, the rate is about one third this amount. Below -18 °C and -10 °C respectively, 10 parts per thousand saline ice and 4 parts per thousand saline ice cease expanding and, as temperatures drop further, contraction occurs. Although the amounts of thermal expansion and contraction may seem small, they can result in pressure ridge development under some circumstances.
Atmospheric and oceanographic forces contribute additional energy to deform pack ice. As ice is subjected to pressure from winds or currents, it may fracture and buckle to produce a rough surface. In new and young ice, this results in rafting as one ice sheet overrides another. In thicker ice, pressure leads to the formation of ridges and hummocks, when large pieces of ice are piled up above the general ice surface and large quantities of ice are forced downward to support the additional weight. As a general rule, the below-water portion of ice is in the order of three to four times as deep as the above-water height.
Note: Total ice thickness below water is three to four times the ice height above the water line.
Pressure arising from strong winds can be severe and usually persists until the wind subsides or changes direction. The extent of ridging caused by pressure depends on whether or not the leeward boundary of the ice field was against land or closely packed ice when onshore winds began. In such cases, the floes within the ice field may become pressed together, eventually increasing to 10/10 concentration, with pressure developing throughout.
Pressure within an ice field can also be caused by tides. Tidal pressure is usually of short duration, lasting from one to three hours and, although less heavy than pressure from winds of longer duration, it can at times bring shipping operations to a halt. Tidal pressure can be particularly significant in restricted channels where the tidal effect is enhanced and ice movement is restricted.
Note: Onshore winds and tidal currents may cause pressure within ice fields. Pressure may be so severe as to restrict a vessel from moving.
Cracks, leads, and polynyas may form as pressure within the ice is released or tension occurs. Offshore winds may drive the ice away from the coastline and open a shore lead or push pack ice away from fast ice. In some regions where offshore winds prevail during the ice season, local shipping and vessel movement may be possible throughout much of the winter season. However, brief periods of onshore wind may cut off any leads and entrap vessels.
Warning: Mariners navigating through open water leads are urged to do so with extreme caution. The navigator should try to anticipate the effect of winds and currents on possible changes in lead conditions.
3.2.6 Ice ablation
Ice may be cleared from an area by winds and/or currents, or it may melt in place. Where the ice field is well broken (open ice or lesser concentrations), wind plays a major part as resulting wave action will cause considerable melting. Where the ice is fast or in very large floes, the melting process is primarily dependent on incoming radiation. Air and water temperatures and some types of precipitation also have a significant effect on ice melt.
Snow cover on the ice acts initially to slow ice ablation, because it reflects almost 90% of incoming radiation back to space. However, as temperatures rise above 0 °C, and the snow begins to melt, puddles form on the ice surface. These puddles absorb about 60% of incoming radiation, causing the water to warm and the puddle to enlarge rapidly. Heat from the melt-water is transferred to the ice below causing the ice to weaken. In this state, it offers little resistance to the decaying action of wind and waves. The puddling of melt-water on the ice, which usually occurs extensively in the Canadian Arctic, promotes accelerated ice decay and breakup.
3.3 Icebergs, ice islands, bergy bits, and growlers
Icebergs and ice islands differ from sea ice in that they represent extreme local hazards to navigation, rather than the limited but widespread problem offered by sea ice. Severe damage can result from hitting glacial ice.
Warning: The glacial ice of icebergs and ice islands is very hard. They should be given a wide berth.
3.3.1 Origin and nature
Icebergs are a common feature of Arctic waters, along the Labrador coast, and on the Grand Banks of Newfoundland. Icebergs (figure 19) differ from sea ice in that they are formed from fresh-water ice originally on land. They form when pieces of glacier ice break off or calve into the sea.
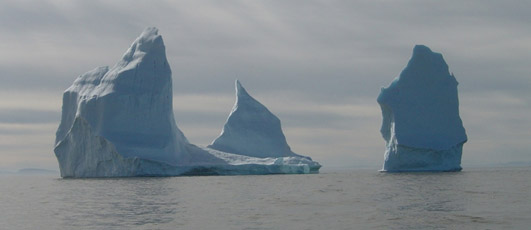
Figure 19 - Photograph of a pinnacled iceberg (photo courtesy of CIS)
A second type of floating glacial ice is created when fragments calve from ice shelves along the northern coast of Greenland and the Arctic Archipelago, particularly Ellesmere Island. The floating pieces of ice are known as ice islands (figure 20). They are mainly found in the Arctic Ocean, Beaufort Sea, and channels of the Archipelago and the eastern Arctic.
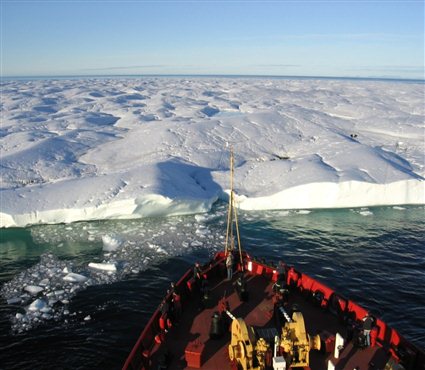
Figure 20 - Photograph of an ice island (photo courtesy of CIS)
Almost all icebergs found along the east coast of Canada originate from the glaciers of west Greenland. Most of the active glaciers along the west Greenland coast are located between Smith Sound and Disko Bay. Melville Bay, from Cape York to Upernavik, is a major source of icebergs; it is estimated that 19 active glaciers produce 10,000 icebergs annually. A second area of importance is Northeast Bay, including Karrats and Umanak Fiords, where about 5,000-8,000 icebergs are calved from 10 major glaciers each year. Disko Bay also produces a small number of icebergs from 2 glaciers.
A few Canadian glaciers on Baffin, Bylot, Devon, Coburg, and southern Ellesmere Islands calve icebergs, but only in small numbers. The annual production of icebergs from Canadian glaciers is estimated to be about 150. Total annual production of icebergs in Baffin Bay is estimated to be 25,000-30,000, although some estimates are as high as 40,000. More than 90% of the icebergs come from west Greenland glaciers.
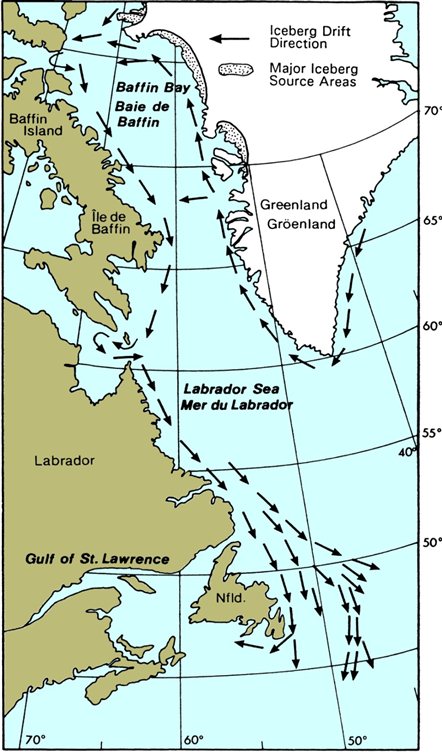
Figure 21 - Sources and main tracks of icebergs in Canadian waters
Text version: Sources and main tracks of icebergs in Canadian waters
A map identifying the major icebergs source areas from Greenland and their general drift direction. They follow the southern coasts of Greenland, up around Baffin Bay, down along the Baffin Island and Labrador coasts, into the Labrador Sea until they melt in the northern Atlantic Sea.
The vectors represent the icebergs' drift direction.
The doted areas on Greenland West coast represent the major icebergs' source areas.
The size of icebergs calved varies from growler size (about 20 square metres with 1 metre above water) to icebergs 1 kilometres long and over 200 metres high. The height-to-draught ratio of an iceberg varies from 1:1 to 1:3 for pinnacle icebergs, to 1:5 for blocky, steep-sided tabular icebergs. A study of icebergs in Davis Strait suggested that a ratio of 1:4 was a good approximation for estimating iceberg size. If the height of an iceberg is 100 metres it would not be unreasonable to expect a draught of 300 to 500 metres. As a result of their substantial draught, even smaller icebergs frequently become grounded in coastal waters and on shoals.
3.3.2 Locations and clustering
An important consequence of the substantial draught of an iceberg is that its drift is strongly influenced by ocean currents, as well as winds. The relative importance of winds and currents on iceberg drift depends on the area and mass exposed to winds and currents and the relative strength of each. Icebergs calved from glaciers on the west Greenland coast usually drift northward (see figure 21) at a rate of 3 to 5 nautical miles per day, before being carried westward across northern Baffin Bay. From there, currents along east Baffin Island carry the icebergs south to the Labrador Sea and onto the Grand Banks of Newfoundland. Along Labrador, drift rates of 10 nautical miles per day are not uncommon.
Whereas the main drift path is anticlockwise in Baffin Bay, it is not uncommon for icebergs to be carried westward across Baffin Bay by smaller current streams which branch off from the West Greenland current. Iceberg drift is seldom direct, with icebergs frequently following lesser currents into bays and inlets. In particular, numerous icebergs are drawn into Lancaster Sound, moving westward through the Sound as far as 85°W. Icebergs also drift southward into Navy Board Inlet and eastward to Pond Inlet. Similarly, icebergs are sometimes carried into Hudson Strait south of Baffin Island. Icebergs have been observed as far west as Big Island, probably in response to strong tidal flows.
Occasionally icebergs enter the Gulf of St. Lawrence, passing through the Strait of Belle Isle. These icebergs are generally small, as the water depths in the Strait (55 metres) limit iceberg draught. Most icebergs entering the Gulf tend to go aground along the Quebec shore, east of Harrington Harbour, although a few have been observed as far west as Anticosti Island and in the Bay of Islands area along the west Newfoundland coast. A considerable number of icebergs can remain grounded in the Strait of Belle Isle.
It is estimated that an iceberg travels between 2,700 and 3,700 kilometres from its place of calving to reach the Grand Banks of Newfoundland. Based on estimated current speeds, an iceberg calved in Melville Bay could complete the trip in one year. It is more likely that it would not remain in the main current and a more realistic estimate of the travel time is 2 to 3 years.
As icebergs drift, they become smaller through melting and calving of ice fragments. Calving is frequent and, by exposing more ice surface to the water, encourages greater melting. Melting occurs both above and below the waterline. As water temperatures vary with depth, it is possible to have melting of the iceberg near the water surface, but not melting at greater depths, where temperatures may be lower than the 0 °C required to melt freshwater ice. Combined with surface melting, an iceberg's centre of buoyancy can change, resulting in unstable conditions and rolling of the iceberg. Icebergs encountered off Newfoundland are generally more deteriorated and unstable than icebergs further north. An iceberg may roll several times per day. Therefore, it is very important for vessels to steer a wide berth around an iceberg in case it rolls.
Based on studies of decaying icebergs, the U.S. Coast Guard International Ice Patrol has developed simple approximations of the deterioration times for icebergs of different sizes, under various water temperature conditions. These are shown in table 6. More information at How does IIP determine the deterioration and drift of icebergs (United States Coast Guard).
Table 6 - Time taken for icebergs of different sizes to deteriorate
| Surface sea-water Temperature (°C) | Small icebergFootnote * | Medium icebergFootnote ** | Large icebergFootnote *** Footnote **** |
|---|---|---|---|
| 0 | 15 | 40 | 90 |
| 2.2 | 8 | 16 | 24 |
| 4.4 | 5 | 10 | 15 |
The melt rate for icebergs in Arctic waters is slow, but, even so, it is unlikely that more than 20 to 25% of the icebergs calved from Greenland glaciers reach western Baffin Bay. It is estimated that half of these melt before entering Davis Strait, and only 20% of the remainder will complete the drift to the Grand Banks.
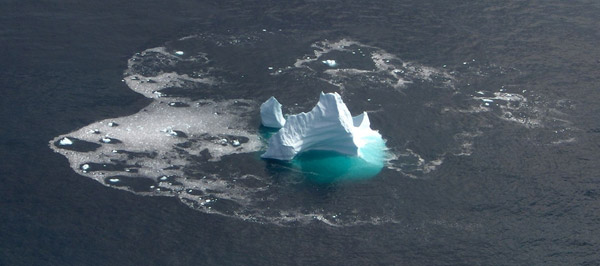
Figure 22 - Calving iceberg (courtesy of the CIS)
In an average year, about 300 icebergs drift south of 48°N, but there is considerable year-to-year variation in this number. Based on observations compiled from the International Ice Patrol (patrol established in 1914 by the agreement of 16 nations with shipping interests in the North Atlantic Ocean), the total, the total number of icebergs crossing 48°N has varied from a high of 1587 icebergs in 1984 to a low of no icebergs in 1966. Figure 23 shows the annual variability between 1951 and 2010. Icebergs drift all year, although when in winter pack ice their drift rate is slowed. As the sea-ice cover along the Labrador and Baffin coasts deteriorates, icebergs move more freely. Within a given year, most icebergs cross 48°N between March and June. On average, almost two-thirds of the icebergs have been observed in April.
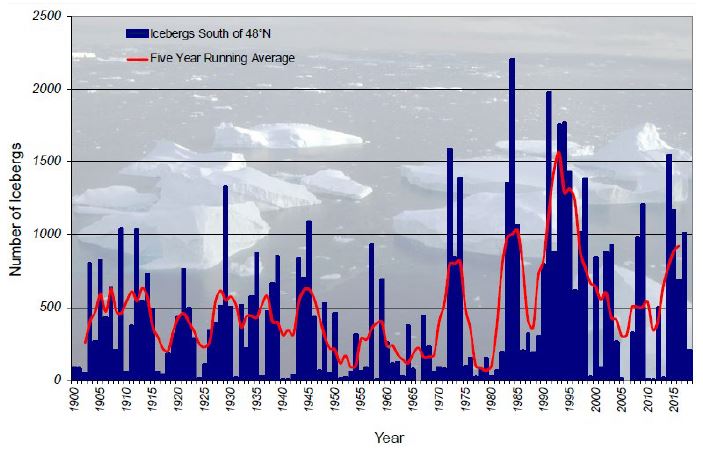
Figure 23 - Annual count of icebergs crossing 48°N latitudeFootnote 7
Text version: Annual count of icebergs crossing 48°N latitude
A graphic representation of icebergs annual count that are found crossing south of latitude 48 degrees North since the beginning of the 20th century. A five-year average (red line) is provided in the graph.
- Vertical axis: The amount of icebergs from 0 to 2500.
- Horizontal axis: Year 1900 to 2018.
3.4 Ice climatology for the Great Lakes
3.4.1 Meteorological influences
Weather has a direct bearing on the planning and execution of winter navigation. Temperatures control the extent and thickness of ice that forms, and the surface winds modify its location, form and distribution. During winter, cold air from the Canadian Arctic can be carried southeastward across Canada, resulting in temperatures far below the freezing point, causing superstructure icing and rapidly increasing the volume and extent of the lake ice present. On the other hand, migratory low pressure centres may result in warm air from lower latitudes sweeping northward and creating melting conditions that last anywhere from a few hours to several weeks. The winter seasons vary considerably in severity depending upon the relative frequency and the paths of these migratory storm centres.
In considering ice formation, ice growth and ice deterioration, the amount of heat exchange between ice, water and air is of basic importance. However, due to the complexity of these processes and their measurement, air temperature is often used to quantify the effect of freezing and melting conditions. More specifically, when the mean air temperature for a day is below 0 °C, the numerical value can be expressed as the number of freezing degree-days (FDDs) and, when above 0° Celsius, expressed as melting degree-days (MDD).
Wind direction and strength during the winter have considerable effect on the ice cover for its thickness, location, and the degree of obstruction to navigation.
3.4.2 Oceanographic factors
The main oceanographic factors influencing the ice regime are bathymetry, currents, and tides. There is a brief description of bathymetry and currents for each lake. Tidal ranges are generally very small.
3.4.2.1 Lake Superior
Lake Superior is the largest of the Great Lakes and is the deepest with the maximum depth of 406 metres in the southeast part of the lake. The Keweena Peninsula and Isle Royale are prominent features in Lake Superior. The Superior Shoal with a minimum water depth of 6.4 metres lies in the middle part of the lake about 85 kilometres east of Isle Royale. The waters of Lake Superior flow outward through the St. Mary’s River into Lake Huron and for the most part currents in the lake are weak. Wind-generated currents are known to produce upwelling of lake water.
3.4.2.2 Lake Michigan
This is the third largest of the Great Lakes and the second deepest with a maximum depth of 281 metres in the central part of the lake. The area to the north of Beaver Island and the Straits of Mackinac are shallow and less than 37 metres deep. Water currents are generally weak in the lake but there exists a circular pattern in southern Lake Michigan that is unique.
3.4.2.3 Lake Huron
Lake Huron is the second largest of the Great Lakes and the fourth deepest with a maximum depth of 229 metres just 27 kilometres west of the Bruce Peninsula. Generally speaking it is deep but northern and eastern shores have shoals extending 5 kilometres offshore in places. The most striking feature of the bottom of the lake is a submerged ridge which extends from Alpena, Michigan across the lake to Kincardine, Ontario. Six Fathom Bank, with a depth of 11 metres, lies on this ridge in mid-lake.
The north and east shores of Georgian Bay are bordered by many islands and shoals while the southwest portion is generally deep. A maximum depth of 168 metres lies just off the north shore of the Bruce Peninsula. Lake Huron receives the waters of Lake Michigan through the Straits of Mackinac and those of Lake Superior by way of the St. Mary's River, and in turn discharges into the St. Clair River. Water currents are generally weak in the lake and the bay.
3.4.2.4 Lake Erie
This is the most southerly of the Great Lakes and is also the shallowest of them. Its maximum depth of 64 metres lies just southeast of Long Point. West of Point Pelee the lake is very shallow with water depths less than 11 metres. Water depths in Lake St. Clair are less than 6 metres. The flow of water in the lake is generally from the Detroit River at the west end in a northeasterly direction to the main outflow through the Niagara River. Water currents in the lake are generally weak.
3.4.2.5 Lake Ontario
Lake Ontario is the smallest of the Great Lakes but is the third deepest with a maximum depth of 244 metres located in the southeastern part of the lake. The northeastern end of the lake (the approaches to the St. Lawrence River) is the shallowest area where water depths are less than 55 metres. The flow of water in Lake Ontario is mainly from the Niagara River northeastward to the St. Lawrence River. Water currents in the lake are generally weak.

Figure 24 - Bathymetry of the Great Lakes (Chart courtesy of ECCC)
Text version: Bathymetry of the Great Lakes
A bathymetric map of the Great Lakes with different shades identifying the bottom depths.
Legend:
- Land = sand colour
- 0-20m = light purple blue
- 20-40m = turquoise
- 40-100m = jade
- 100-200m = royal blue
- 200+m = dark blue
A distance scale up to 200 km is provided to measure in increments of 25, 50 and 100 km. The scale is also converted to nautical miles.
3.4.3 Ice regime for the Great Lakes
3.4.3.1 Lake Superior
Initial ice formation begins in harbours and bays along the north shore, in the western portion of the lake, and over the shallow waters of Whitefish Bay normally near the end of November to early December. The amount and thickness of ice increases so that the entire perimeter of the lake becomes covered and then extends many kilometres out into the lake by mid-winter. At the peak of the season at the last half of February, ice typically covers 75% of the lake. The eastern portion of the lake between Stannard Rock and Caribou Island will usually remain open water throughout the winter.
Break-up normally begins in March and the ice is in a state of deterioration by the end of the month. Most of the lake is open water by mid-April; however, winds and water currents can cause the ice to drift into the southeastern end of the lake.
Variations
Ice conditions can vary greatly from year to year. In a mild winter, the maximum ice coverage in Lake Superior may attain only about 12% (1997-98) while during a severe winter coverage may reach 100%. Ice has formed as early as the first week of November and persisted as late as the last week in May.
Ice thickness
In sheltered harbours and bays, ice tends to grow to 45 to 85 centimetres during a normal winter. Rafting can create ice thicknesses up to a metre or so. Windrows of grounded ice in Whitefish Bay can pile up to 7 to 8 metres or more above lake level. Offshore ridges of ice can result in total ice thicknesses reaching 25 metres.
Warning: Shipping lanes in whitefish bay and entrances to harbours in lake superior are much affected by drift ice moving in response to forcing winds.
3.4.3.2 Lake Michigan
Lake Michigan’s north-south orientation and length mean that it can have ice formation and deterioration occurring simultaneously. Initial ice formation begins in Green Bay normally during the first half of December. The next areas to become ice covered are the Straits of Mackinac and the shallow areas north of Beaver Island. In these areas ice starts to develop in the first week of January. The ice forms and accumulates in a southerly direction with a rapid build-up along the Fox Islands and a slower growth rate around the southern perimeter. Maximum ice cover occurs about the middle of February with usual maximum coverage around 25%. The central portion of the lake south of 45º North latitude usually remains open water throughout the winter.
Break-up normally begins the second half of February and progresses from south to north. Most of the lake is open water by the first half of April. The strait and island areas of Mackinac usually produce formidable ice ridges which linger into late in the season.
Variations
Ice conditions can vary greatly from year to year. In a mild winter, maximum ice coverage in Lake Michigan may be only 12% while during a severe winter it may increase to near 85%. Ice has formed as early as the last week of November and persisted as late as the second week of May.
Ice thickness
In sheltered harbours and bays, ice typically grows to 45 to 75 centimetres over winter. Rafting can create ice thicknesses up to a metre or more. Areas of ridges of ice in the Straits of Mackinac can reach up to nine metres above sea level with depth up to 2 or 3 times greater.
3.4.3.3 Lake Huron and Georgian Bay
The orientation and patterns of ice formation of Lake Huron are similar to those of Lake Michigan; however, temperature differences between north and south are not as great. Initial ice formation begins in North Channel and along the east coast of Georgian Bay during the second half of December. As the winter progresses, ice expands around the coastal areas and then extends out into the lake. Maximum ice cover occurs around the middle of February with about 50% coverage in Lake Huron and 90% coverage in Georgian Bay. The deep central and north portion of Lake Huron usually remain open water throughout the winter.
Break-up normally begins in March with the entire lake clearing by the second week of April. Large volumes of ice can drift into the southern portion of Lake Huron resulting in a heavy concentration of ice at the entrance to the St. Clair River.
Variations
Ice conditions can vary greatly from year to year. In a mild winter, the maximum ice coverage on Lake Huron and Georgian Bay may be as low as 26% (winter 2001-02) while during a severe winter, the coverage on Lake Huron and Georgian Bay can be more than 95%. Ice has formed as early as the last week of November and has persisted as late as the third week of May.
Ice thickness
In sheltered harbours and bays, lake ice typically grows to 45 to 75 centimetres during a normal winter. Areas of ridging can contain ice thicknesses of up to 18 metres.
3.4.3.4 Lake Erie and Lake St. Clair
Ice formation begins in the western end of the lake and in Long Point Bay normally during the second week of December. Elsewhere the amount of ice cover begins to accelerate in early January and is usually at its maximum extent (70%) in February. Lake St. Clair is normally completely ice covered or consolidated from the middle of January until March.
Break-up for Lake Erie normally begins near the end of February with the lake becoming mostly open water by the first week of April. The eastern end of the lake is usually the last area to clear.
Variations
In a mild year, the maximum extent of the ice cover could be as little as 8% of the lake's surface. During severe winters, 100% coverage can occur. Ice has formed as early as the first week of December and has persisted in the Buffalo area as late as the middle of May.
Ice thickness
In sheltered bays, ice typically grows to 25 to 45 centimetres over winter. Rafting and ridging of ice can create aggregate ice thicknesses in excess of 20 metres during a single winter storm.
3.4.3.5 Lake Ontario
Ice formation begins in the Bay of Quinte normally during the third week of December. Ice begins to form in the bays at the eastern end of the lake and in the approaches to the St. Lawrence River during the first week of January. An extensive ice cover does not appear until the last week of January and is usually confined to the eastern end of the lake. Maximum ice cover which usually occurs during the first half of February totals about 17%. Break-up normally starts late in February with the lake becoming generally open water in late March. Ice may be found below Niagara Falls, in protected bays and in the approach to the St. Lawrence River somewhat later.
Variation
In a mild winter, ice coverage on Lake Ontario is only about 10% while in a severe winter it can increase to 65%. Lake Ontario will rarely reach complete ice cover; one year this happened was in 1979. Ice has formed as early as the third week of November and has persisted as late as the last week of April.
Ice thickness
In the sheltered bays, ice typically grows to 20 to 60 centimetres over winter. Ridging, rafting and hummocking can significantly increase these thicknesses.
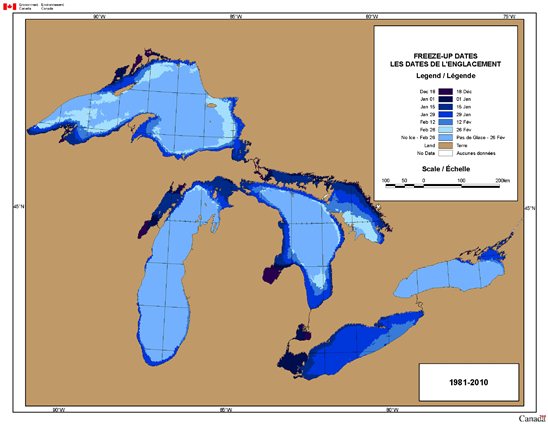
Figure 25 - Freeze-up dates for the Great Lakes (Chart courtesy of ECCC)
Text version: Freeze-up dates for the Great Lakes
A map of the Great Lakes with different shades identifying the freeze-up dates (dates range when ice start to form). Database is based on averages from 1981-2010.
Legend:
- Dec 18 = black
- Jan 01 = dark blue
- Jan 15 = marine blue
- Jan 29 = royal blue
- Feb 12 = blue
- Feb 26 = soft turquoise
- No ice - Feb 26 = soft blue
- Land = brown
- No data = white
A distance scale up to 200 m is provided to measure in increments of 25, 50 and 100 m.
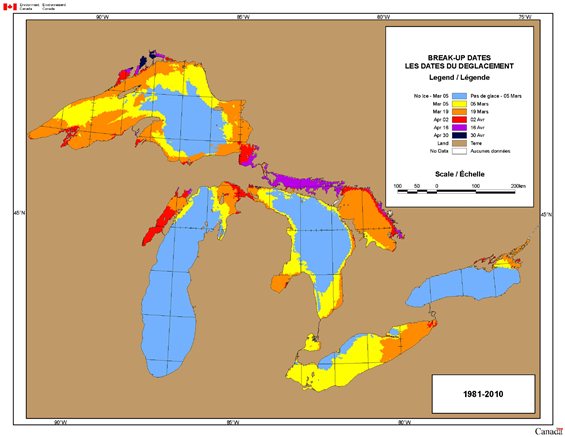
Figure 26 - Break-up dates for the Great Lakes (Chart courtesy of ECCC)
Text version: Break-up dates for the Great Lakes
A map of the Great Lakes with different shades identifying the break-up dates (dates range when ice start to melt). Database is based on averages from 1981-2010.
Legend:
- No ice - Mar 06 = soft blue
- Mar 06 = yellow
- Mar 19 = orange
- Apr 02 = red
- Apr 16 = purple
- Apr 30 = black
- Land = brown
- No data = white
A distance scale up to 200 m is provided to measure in increments of 25, 50 and 100 m.
3.5 Ice climatology for the St. Lawrence River
The St. Lawrence River flows from the eastern end of Lake Ontario to the Saguenay River and estuary where it flows into the Gulf of St. Lawrence. Ice initially forms during the first half of December between Montreal and Quebec City. The combination of river currents and winds causes new ice to grow and spread along the River's south shore. By the end of December, the south half of the estuary, west of a line from Pointe-des-Monts to Marsoui, is ice covered. Normally, freeze-up in the remainder of the river begins in early January. Particularly extensive areas of fast ice are found in Lac Saint-Pierre, in sections of the river between Lac Saint-Pierre and Montreal where islands hold the ice fast, and in the non-navigable channels between Montreal and Sorel.
Through the winter, ice drift continues above Quebec City. Icebreaker maintenance supports this drift and, because of the continual movement, large ice floes are seldom formed and year-round shipping is maintained between Quebec City and Montreal. Prevailing northwest winds tend to force the drifting ice along the south shore, resulting in low ice concentrations, or open water, along the north shore.
Tidal flows can modify these conditions, with flood tides causing ice congestion in narrow areas of the shipping channel. Under ebb tides, congestion can result in Quebec harbour between Lauzon and the west point of Isle d'Orleans, when ice floes broken away from fast ice block the normal drift of ice near the harbour.
Batture ice floes (figure 27) are large, thick, uneven and discoloured floes up to 8 kilometres or more across. They form in the shallows along the entire length of the St. Lawrence River. Batture ice floes are composed of ice of different thicknesses formed under pressure during ebb tides, the whole mass freezing together and gradually increasing in size with each successive tide. As the tidal range increases between neaps and springs, large sections of grounded ice break away and drift down the river. These floes present a formidable hazard to shipping and mariners are advised to avoid them if possible. They are quite easy to identify as the ice is discoloured and the floes appear much higher above the water than the surrounding ice.
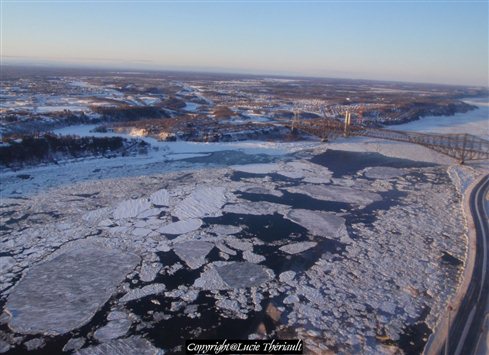
Figure 27 - Batture ice drifting down towards the Quebec City Bridge (Photo courtesy of CIS)Footnote 8
Warning: Batture floes are a major hazard to navigation through the entire St. Lawrence river. Vessels should avoid contact with them if possible.
The vessel channel is easily blocked if the ice on each side of it is dislodged from the banks and shoals to which it is attached, either through natural causes or by the wash of passing vessels. When the ice does break away, it is liable to do so in very large sheets that move across the channel and initiate the formation of a jam. At certain times this batture ice is particularly liable to be dislodged and it may then be necessary for the CCG to impose speed restrictions in certain sections of the river.
When this happens, it is of overriding importance that the jam be broken and the channel restored as quickly as possible to stop the rise in the river level. This can only be done by attacking the jam from downstream, so that ice loosened by the icebreakers may be carried away by the current. In order to do this, all available icebreakers must be concentrated at the jam and will not be available to assist individual vessels. However, this procedure, which is the only way to clear the channel, is in itself the best way of freeing any beset vessels and restoring the movement of traffic. At such times it is vital that the operation of the icebreakers not be hampered by the avoidable presence of other vessels in the area of the jam. It may, therefore, be necessary to delay sailings or to curtail movement in that part of the river.
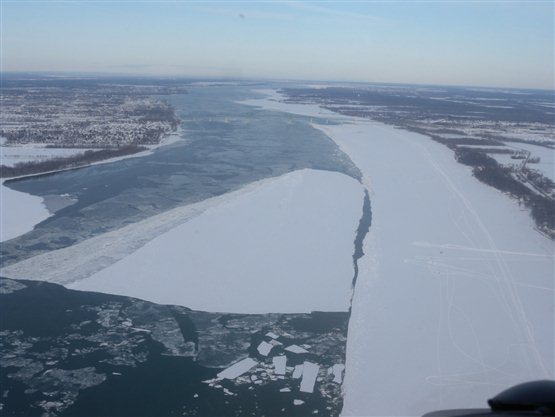
Figure 28 - The vessel channel can be easily blocked if ice is dislodged from the banks (Photo courtesy of CIS)
Night navigation in the St. Lawrence River between Les Escoumins and Montreal should not be attempted without a thorough knowledge of the ice conditions ahead of the ship.
In the Port of Montreal, the combined effect of an ice control structure and the rapides de Lachine serve to maintain dispersed ice conditions throughout the winter. Upstream of Montreal to Lake Ontario, the shipping season is restricted and is controlled by the operation of the St. Lawrence Seaway Authority.
Even light ice conditions can be treacherous on the St. Lawrence River. Fresh water, currents, tide and the water depth can push frazil ice down to depths of more than 10 metres and enter sea bays, plugging seawater cooling inlets. If water cannot be obtained for the cooling system, the engines will not perform properly and may eventually overheat, causing engines to shut down or become seriously damaged. The design of vessels operating in ice must prevent the cooling system from becoming blocked by slush ice. This is an unusual occurrence and is rarely encountered in other parts of the world. Section 5.5.1 has additional information.
Breakup on the St. Lawrence River usually begins near the middle of March in leeward and thinner ice areas. The River is normally clear of all ice by the first week of April.
3.5.1 Ice Regime of the Gulf of St. Lawrence
The Gulf of St. Lawrence area covers the St. Lawrence Estuary eastward from Québec, the entire Gulf of St. Lawrence, the waters south of Nova Scotia and the waters south of Newfoundland eastward to the Islands of Saint-Pierre-et-Miquelon.
3.5.1.1 Normal pattern of development
The first ice formation in this area occurs in the St. Lawrence River itself normally during the second week of December and the floes are carried downstream to the Québec City area shortly after the middle of the month. This ice is thin and it is primarily a freshwater type but it spreads downstream gradually, aided by wind and ebb tides. During the fourth week of December, this ice reaches the mouth of the Saguenay River and mixes with the ice forming in the salt water of this part of the Estuary. The new ice formation occurs in the coastal areas first and then develops and spreads seaward. Due to the currents and prevailing west and northwest winds, ice growing in the St. Lawrence River Estuary spreads more rapidly eastward along the south side and reaches the north Gaspé Peninsula shoreline near the end of December.
In the third week of December, ice begins to form in the coastal shallows of New Brunswick. In the last week of December new ice starts to spread seaward along the New Brunswick coast and develops in coastal areas of Northumberland Strait. At the end of December Northumberland Strait is partially covered with new and grey ice. The entire Northumberland Strait becomes ice covered in the first week of January.
During the last week of December, loose areas of new ice begin to form in the Strait of Belle Isle as well as along sections of the north shore of the Gulf of St. Lawrence. At month’s end, the highest concentrations can be found in Northumberland Strait, in the coastal areas of New Brunswick, along the south sides of the St. Lawrence River Estuary and Chaleur Bay, and in some of the coastal portions of the north shore of the Gulf. Most of this ice is new and grey, and coastal fast ice outlines are being established.
At the beginning of January in the southwestern portion of the Gulf, the ice cover increases more in concentrations rather than area extent. As the ice spreads away from the shore, the warmer waters tend to melt the ice. During the month of January, the growth and spread of ice proceeds eastward across the Gulf more quickly than it progresses southward from the north shore. By the middle of the month the leading edge of the ice has reached North Cape, PEI and meanders northward through Honguedo Strait to the western tip of Anticosti Island. The ice concentrations, at that time, have reached the very close pack range in Northumberland Strait, Chaleur Bay, most of the Estuary while lower concentrations are found in the northern section of the Estuary as well as along the ice edge. Much of this ice remains as new and grey types, but grey-white has now developed in parts of Northumberland Strait, along the south sides of the St. Lawrence River Estuary and Chaleur Bay as well as in the southern section of the Belle Isle Strait. Along the north shore, the ice has spread outward only 10 to 20 kilometres except in the Northeast Arm where the seaward extent is more likely 25 to 40 kilometres. Here ice concentrations are mostly in the open to close range with very close ice conditions in the Northeast Arm.
By the end of the third week of January the ice edge has reached East Point on Prince Edward Island and extended northward to the southeast end of Anticosti Island and then northeastward to near Point Riche Peninsula on the west coast of Newfoundland. The ice concentrations within the pack is generally very close pack except looser within 20 to 50 kilometres of the ice edge. The predominant ice type is mostly grey ice with grey-white in Northumberland Strait, along the south sides of the St. Lawrence Estuary and Chaleur Bay as well in the southern half of Belle Isle Strait. Due to the prevailing northwesterly winds and the outflow of water currents which follow the Laurentian Channel, the grey-white ice from Gaspé Passage tends to drift southeastward towards the northern shore of Îles de la Madeleine. The ice reaches Cape North near the end of January and then start to move in the western section of Cabot Strait. The mild northeastward current around Cape Anguille off the west coast of Newfoundland tends to delay ice formation south of the Pointe Riche Peninsula. At the end of January, grey-white ice is beginning to show up in the western part of the Gulf, in Gaspé Passage, in the Northeast Arm, and along the west coast of Cape Breton.
Historically, during the second week of February, the ice drifting southward through Cabot Strait will reach the approaches to Sydney and linger until the first week of April. The ice cover continues to grow and thicken as it spreads to cover most of the remaining areas of the Gulf by the third week of February. The exception is a 10 to 30 kilometers coastal lead along the Newfoundland coast south of Cape Saint George. At the beginning of February grey-white and grey ice generally predominates inside the pack but thin first year ice gradually develops during the course of the month. By the end of the third week of February thin first year is found in Northumberland Strait, along the northwest coast of Cape Breton, along the north coast of les Îles de la Madeleine, along the west coast of Newfoundland as well as along the south shores of Chaleur Bay and the Estuary. Over the northern portions of the St. Lawrence Estuary and Gulf, the predominant ice type remains new and grey. The reason the ice remains thinner over these areas is that offshore winds push the ice southward.
From the later part of February until the middle of March, the ice in the Gulf has reached its maximum extent and much of the ice continues to grow to the first-year stage of development. However, because of the continuous southward drift of the pack in the Gulf, the ice remains at the grey-white stage over the northwestern portions. The lead along the west Newfoundland coast, particularly north of the Port-au-Port Peninsula, is closed and there can be ice drifting into Cabot Strait.
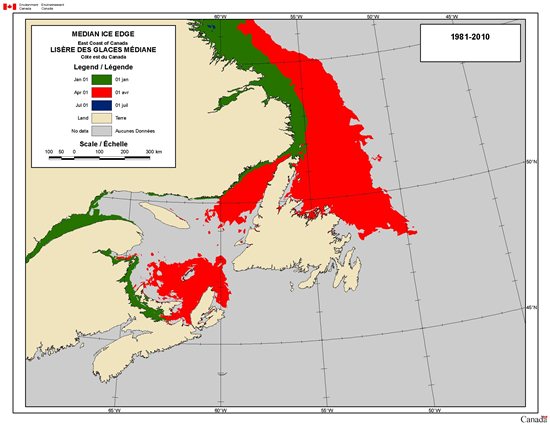
Figure 29 - January, April, and July ice edge positions off the East Coast of Canada (Chart courtesy of ECCC)
Text version: January, April, and July ice edge positions off the East Coast of Canada
A map of Canadian East Coast with different coloured zones identifying the median ice edges on the 1st of specific months between 1981 and 2010.
Legend:
- Jan 01 = green
- Apr 01 = red
- Jul 01 = marine blue
- Land = tan
- No data = grey
A distance scale up to 300 km is provided to measure in increments of 50 and 100 km.
3.5.1.2 Normal pattern of dispersal and melting
Dispersal of the ice begins in late February and is first evident in the Estuary near the mouth of the Saguenay River where ice concentrations fall to very open range. Tidal upwelling of warmer water at the western limit of the deep channel through the Estuary combined with the general rise of air temperatures in the spring tend to melt the ice. The upwelling is a feature of the location and a certain amount of open water is nearly always present in this area. Snow and ice reflect a large proportion of the solar radiation; the absence of ice permits an increase in solar warming of the water. Openings in the ice cover are thus extremely important in the spring for they act as centres of ice decay. The reduction in the ice concentrations is slow until the second week in March then gradually accelerates. By the middle of March, extensive open water areas exist along the north side of the St. Lawrence Estuary and the north shore to Natashquan, and south of Anticosti Island. By this same time, ice concentrations through the remainder of the Estuary and in Gaspé Passage become reduced to very open to open range except along the north shore of the Gaspé Peninsula. The ice concentrations along the main shipping route through the central Gulf are decreasing rapidly. During the last half of March decreasing median ice concentrations are evident through the centre of the Gulf but congestion persists in the southwestern portion and in the Northeast Arm. Since the thinner forms of ice will melt and decay faster, the predominant ice types are the thicker forms of ice. Ice concentrations through Northumberland Strait begin to decrease during the third week of March in the western end and progress southeastward. In late March the Estuary is usually free of ice and the inner ice edge has passed Anticosti Island.
During the early days of April, ice in the main shipping route through the Gulf clears, separating into 2 areas: the southwestern Gulf and the waters surrounding Cape Breton, and the area from the Port-au-Port Peninsula to the Strait of Belle Isle. Once this separation has occurred, navigation into the Estuary is unhindered and re‑formation of an ice barrier across the shipping route does not occur. Of these two areas, the southwestern Gulf melts first. The last of the ice in Northumberland Strait and around Cape Breton Island melts normally near mid-April. At this time, the only ice to be found is the decaying coastal fast ice and this melts by the last week of April.
The final area to lose its ice cover is the Northeast Arm. The retreating ice gradually melts northward during April and into May. By the third week in May, the sea ice has finally all melted, but icebergs can present a hazard to shipping during the summer. The date that the last ice clears can vary significantly. In 1991, sea ice persisted in the Northeast Arm into the middle of July and the following year, sea ice in the Strait of Belle Isle did not melt until the end of July.
3.5.1.3 Ice features of the area
Fast ice for most coastal areas in the Gulf has a limited extent. It forms in all the smaller bays and inlets from Gaspé to Cape North, from Pointe-des-Monts to BlancSablon and from Cape Anguille to Flower’s Cove. Melting “in situ” is the normal decay procedure in these smaller areas.
In the Estuary the tendency for an eastward motion of the ice is very apparent. Leads are common along the shore from Pointe-des-Monts to the Saguenay River, and congestion is prevalent along the Gaspé Peninsula. Wind and water motion all contribute to this pattern producing thicker, congested ice that follows the shore as it moves into the main body of the Gulf. A very difficult ice area is created across the entrance to Chaleur Bay as some of the thicker ice from the Gaspé Passage moves into the area. As the ice continues its south and southeastward progression into the central part of the Gulf it produces an ice cover of large floes of thick ice, combined with new ice formation, from Gaspé Passage to Cape Breton Island. Leads and areas of dispersed ice are created along the New Brunswick and Prince Edward Island shores in response to the wind but, in general, the southwestern section of the Gulf becomes congested with thick ice in large floes that can exert considerable pressure against Cape Breton Island and the northwestern shores of the Îles de la Madeleine.
In the northeastern Gulf the ice motion is much more restricted by the windinduced drift from west to east resulting in occasional congestion in the Bay of Islands area. Often, an area of thick and deformed ice is prevalent from the Port-au-Port Peninsula northward. Coastal leads can develop in this area when easterly winds prevail but lateral motion of the ice along the coast does not often develop.
Very large floes, locally called “battures”, are sometimes encountered in the northwestern Gulf of St. Lawrence in March. These are dislodged fragments of the fast ice which forms over shoals along the south shore of the Estuary and which have been subsequently dislodged by spring tides during mild spells. Battures are noted for their size, roughness, and dirtiness, and may carry a very thick snow cover that makes them very difficult to penetrate. They constitute a severe hindrance and a hazard to navigation.
In the Gulf of St Lawrence, the ice is mobile and free to move. Floes are generally smaller when compared with those found in the Canadian Arctic. Thus, ridging can be rather extensive in area but not developed to any great height. The height of ridging seldom exceeds 2 metres and is generally less than 1 metre. However under conditions of extreme pressure along windward shores, such as the west coast of Newfoundland, ice floes may pile up to 13 metres above sea level. Puddling of the ice in the Gulf is rarely well developed. The ice is more subject to melting from below as a result of warmer water than it is to melting because of heat absorption on the surface.
When ice drifts through Cabot Strait into the Atlantic Ocean, water currents encourage its southward drift past Sydney and down to the area of Scatarie Island. The entire area of the strait only becomes covered with ice when winds hold it against the Newfoundland shore. When the winds diminish or change direction, inflowing currents around Cape Ray quickly create a lead northward towards Cape Anguille and eventually to Cape St. George. A pattern is usually established each winter for the general direction of ice drift once it leaves the Scatarie Island area. In some years, usually the colder ones, the pack continues eastward and has been known to reach as far as Saint-Pierre-et-Miquelon. In other years, when easterly winds are common it follows the Cape Breton coast, ice progresses westward towards Chedabucto Bay and sometimes along the coast of mainland Nova Scotia. In 1987, ice filled the harbour at Halifax and blocked the entrance to Bedford Basin. Weak water currents strengthened by the wind flow, are responsible for the extent of this drift. Most often the drift is generally southward but the distance it moves is not great.
Although old ice is not normally a great concern in the Gulf of St. Lawrence, old ice can drift into the Northeast Arm through the Strait of Belle Isle. Some of these old ice floes survived to drift to the north shores of Anticosti Island in early June of 1991.
Ocean swells from storms in the Atlantic Ocean can enter through Cabot Strait and cause extreme fracturing of the floes in the Iles de la Madeleine to Cabot Strait areas.
3.5.1.4 Variability of Total Ice Coverage
For the period 1981 to 2010, the most ice encountered in a single season in the Gulf of St. Lawrence occurred in 1989/90; the least amount of ice occurred in 2009/10. The ice coverage varies considerably from year to year but in general, there were above normal conditions from 1980/81 to 1994/95 and then below normal conditions from 1995/96 to 2009/10. Examples of minimum and maximum ice conditions for the entire East Coast region are provided to illustrate the spatial extent of such ice conditions.
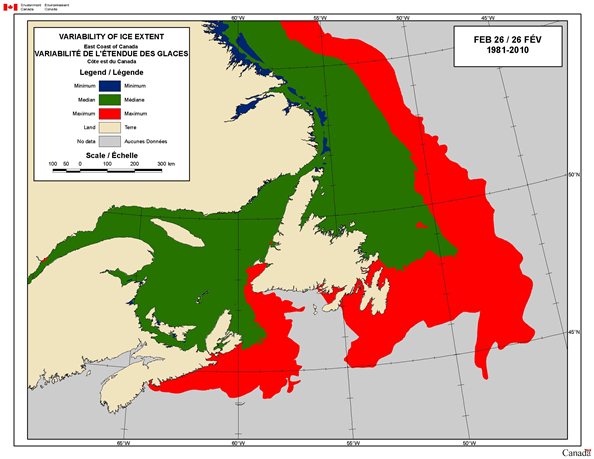
Figure 30 - Variability of ice extent on the East Coast (Chart courtesy of ECCC)
Text version: Variability of ice extent on the East Coast
A map of Canadian East Coast with different coloured zones identifying the variability of ice extent noticed on each Feb 26th between 1981 and 2010.
Legend:
- Minimum = marine blue
- Median = green
- Maximum = red
- Land = tan
- No data = grey
A distance scale up to 300 km is provided to measure in increments of 50 and 100 km.
3.6 Ice climatology for the East Coast
3.6.1 Meteorological influences
Weather has a direct bearing on the planning and execution of winter navigation because temperatures control the extent and thickness of ice that forms, and the surface winds modify its location, form and distribution. Winds also play a major role in the extent of the ice cover especially at the beginning of the season; strong winds can cause ice destruction when the ice is relatively thin and temporarily suppress ice development. During winter, cold air from the Canadian Arctic can be carried seaward across Eastern Canada, resulting in temperatures far below the freezing point, causing superstructure icing and rapidly increasing the volume and extent of the sea ice. On the other hand, migratory low pressure centres from the Southeastern United States may result in mild air sweeping northward and creating melting conditions that last anywhere from a few hours to several weeks. The winter seasons vary considerably in severity depending upon the relative frequency and the paths of these migratory storm systems.
3.6.1.1 Water currents
The general water motion (figure 29) over these areas is relatively simple but the details are complicated. In the Gulf of St. LawrenceSt. Lawrence, the current is generally counterclockwise. In the Estuary of the St. Lawrence River there is a net eastward current but superimposed on it are tidal streams that alternately accelerate and decelerate the motion. The current is strongest at 2 to 12 nautical miles offshore of the Gaspé Peninsula and has a mean speed of 6 to 10 nautical miles per day. Once into the main portion of the Gulf, the water spreads over the Madeleine shallows and drifts generally towards Cabot Strait but some portions also follow the deep Laurentian Channel directly across the Gulf. After reaching the vicinity of Cape Breton Island, the current, known as the Cape Breton Current, pours around Cape North at speeds of 5 to 7 nautical miles per day, sweeps through Sydney and dissipates on the Scotian Shelf off Scatarie Island. Typical rates of motion over the Madeleine shallows (area between Prince Edward Island and Îles-de-la-Madeleine) of 3 to 5 nautical miles per day. There is a northeastwardflowing current, having a mean speed of 2 to 4 nautical miles per day, flowing along the west coast of Newfoundland past Bay of Islands and Daniel’s Harbour.
The general water motion in the offshore areas of Southern Labrador and East Newfoundland is dominated by the cold Labrador Current. Off the Labrador coast, the southward motion is mainly confined to the continental shelf and the water is coldest in the upper layers near shore. After passing Hamilton Inlet, just as the continental shelf widens, so does the breadth of the current. As a result, it decelerates and floods eastward over the Grand Banks while portions of the current continue southwestward from Cape Race towards Nova Scotia. In the Belle IsleNewfoundland area, surface currents are usually less than on the Labrador coast, and the drift westward from Cape Race towards Nova Scotia waters is even slower. Through the Strait of Belle Isle is a variable tidal stream which complicates the water motion, but overall there is a significant current flowing into the Gulf of St. Lawrence with a mean speed of 6 to 8 nautical miles per day. Along the northern Labrador Coast, rates of motion are in the range of 8 to 10 nautical miles per day but these speeds can vary from one season to the next or one year to the next.
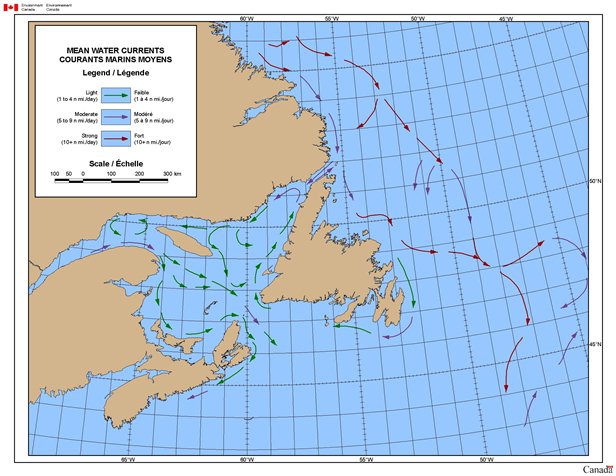
Figure 31 - Surface currents on East Coast of Canada (Chart courtesy of ECCC)
Text version: Surface currents on East Coast of Canada
A map of Canadian East Coast with mean water currents vectors. They identify the general directions and speed water bodies follow.
Legend:
- Light (currents of 1 to 4 nautical miles per day) = green arrows
- Moderate (5 to 9 nm/day) = charcoal arrows
- Strong (10+ nm/day) = red arrows
A distance scale up to 300 km is provided to measure in increments of 50 and 100 km.
3.6.1.2 Tides
The tidal ranges on the Labrador and Newfoundland coasts are fairly small but consistent, for, at most locations the mean range is from 0.8 to 1.6 metres. In the Gulf of St. LawrenceSt. Lawrence, the situation is somewhat more complicated because the tidal surge enters from both Cabot Strait and the Strait of Belle Isle. The main tidal surge progresses in a counterclockwise manner around the Gulf after entering at Cabot Strait and mean ranges vary from 0.8 to 1.1 metres at Cape North and Cape Ray to 1.2 to 1.5 metres on the west coast of Newfoundland and along the north shore of the Gulf. In the Estuary, ranges increase progressively towards the southwest from 2.5 metres in the Pointe-des-Monts to Mont-Joli area to about 4.1 metre near Quebec City. In Chaleur Bay the tidal range is from 1.3 to 2.0 metres but in the Îles de la Madeleine only 0.7 metre. Northumberland Strait has a complicated tidal pattern. In the west end there is essentially 1 tide per day while in the eastern section there are the normal 2 with ranges of 1.2 to 1.8 metres. The Strait of Belle Isle has tides in the 0.8 to 0.9 metre range.
The major effect on the ice from these tidal forces and tidal streams is that the ice moves back and forth as the tides rise and fall. It is most apparent in the upper Estuary but is also apparent in Chaleur Bay and its approaches. Fast ice in these areas tends to be limited due to the constant motion.
3.6.1.3 Bathymetry
The bathymetry of these areas is reasonably well known. The Gulf of St. Lawrence has a deep trench, known as the Laurentian Channel, running from Cabot Strait to the Saguenay River with depths of 500 metres decreasing to 200 metres above Rivière du Loup. The Saguenay River itself has water depths of 90 to 275 metres.
There is an extension of this deep trench into Jacques Cartier Strait and the Northeast Arm of the Gulf with water depths of 175 to 275 metres. The southwestern part of the Gulf averages less than 75 metres in depth and the limiting water depth in the Strait of Belle Isle is 50 metres. Northumberland Strait also has shallow water depths running between 17 and 65 metres with the deepest waters located at each end of the strait. The fishing banks south and east of Nova Scotia are relatively shallow with water depths mostly between 50 and 90 metres.
The Grand Banks to the eastsoutheast of Newfoundland are very well known and have average depths of about 75 metres. To the northeast between Fogo Island and the Strait of Belle Isle, depths are somewhat greater averaging over 300 metres but there are a few small banks with depths less than 200 metres.
Along the Labrador coastline, 50‑100 kilometres from shore there is a “marginal trough” with depths ranging from 200‑800 metres. Farther offshore there are a series of broad banks with minimum depths in the 100‑200 metres range. The continental shelf extends 150‑175 kilometres from shore.

Figure 32 - Bathymetry of the East Coast (Chart courtesy of ECCC)
Text version: Bathymetry of the East Coast
A map of Canadian East Coast with its broad bathymetry. Lines identify 100, 200 and 1000m.
- Legend:
- Land = brown
- 100m = pink lines
- 200m = turquoise lines
- 1000m = purple lines
A distance scale up to 200 km is provided to measure in increments of 50 and 100 km. The scale is also converted into nautical miles.
3.6.1.4 Climatic factors
In considering the ice regime of an area such as the Gulf of St. Lawrence or the waters surrounding Newfoundland, there are 2 major climatic factors. First, mean temperatures during the winter do not fall very far below the freezing point and as a result very cold or very mild winters have a very significant effect on the extent and severity of the ice cover. The second climatic factor is the winter winds from west through north will nearly always be cold and dry whereas those from the southwest through south to northeast will tend to be mild and moist. This has a decided effect on the location of areas of ice compaction and ice dispersal.
3.6.2 Ice regime of East Newfoundland waters and South Labrador sea
East Newfoundland and South Labrador waters cover the offshore areas south of latitude 55oN as far as sea ice extends, along the south coast of Newfoundland as far west as the Islands of Saint-Pierre-et-Miquelon, and in the Strait of Belle Isle.
3.6.2.1 Normal pattern of development
Variations in the extent of ice over these waters are great because both winds and temperatures are effective in changing the location of the edge. In a cold winter, such as 1990-91, the ice could persist as late as the third week of July in the East Newfoundland waters. Conversely in a mild winter, such as 2009-10, the ice could have cleared from east Newfoundland before the end of April.
Because of its latitude, location away from the ocean, and low salinity, Goose Bay and Lake Melville are the first areas along the south Labrador Coast to freeze and both are consistently ice covered by mid-December. The initial freeze over at Goose Bay usually occurs during the third week of November but growth is slow and ice thickness by mid-December is nearly always less than 30 centimetres. Ice spreads slowly across Lake Melville, since the ice formation is slowed by strong wind conditions. It is not until mid-December that a complete cover is consistently present. Ice appears in the coastal waters during the third week of December and spreads seaward. The median ice edge spreads southward to the northern part of the Strait of Belle Isle by the fourth week of December and to the northern tip of Newfoundland before the end of the month.
During January, the mean ice edge expands seaward and spreads southward reaching White Bay and latitude 50°N in the third week of the month. Ice concentrations within about 80 kilometres of the ice edge are close pack or looser and predominant ice types are new and grey becoming grey and grey-white ice off the southern Labrador Coast. It is at this time that coastal fast ice begins to form among the islands of Notre Dame Bay and is normally established by the early days of February. The advancing ice from the north merges with the developing ice from Notre Dame Bay normally during the last week of January. By the end of the month, the pack ice begins to drift off to the southeast from Cape Freels. Ice concentrations remain looser within about 80 kilometres of the ice edge. Predominant ice types in most of the Newfoundland waters are new and grey, but have developed to the grey-white and first-year ranges north of the Northern Peninsula.
During February the ice belt broadens considerably in width. The southern limit progresses to near Cape Bonavista by mid-month and to Baccalieu Island by the end of the month. Ice concentrations remain looser near the southern and eastern ice edges with very close conditions within the pack. Grey ice predominates along the southern ice edge at the beginning of February and grey-white to first-year by the end of the month. The maximum southern extent of the ice occurs from the end of February to the middle of March.
3.6.2.2 Normal pattern of dispersal and melting
The first sign of break-up occurs in Notre Dame Bay around the middle of March when open water leads begin to slowly expand. During the last half of March, the rate of melting at the ice edge increases sufficiently to counterbalance the southward ice drift, and slow retreat of sea ice begins. It recedes only to the latitude of Cape Freels by the middle of April and then to north of Fogo Island by the end of the month. During this time the whole pack south of Hamilton Inlet becomes narrower because of melting along the eastern edge. It is only near the Labrador coast that ice concentrations remain in the very close range. Otherwise, mostly very open to close ice conditions predominate with first-year ice being the main ice type, but embedded old ice floes can also exist.
The rate of melting increases with the southern ice edge retreating north of the Strait of Belle Isle in the third week of May. It is this melting of the pack ice that exposes the icebergs that have been carried south by the Labrador Current and their numbers in the Newfoundland waters at this time of year are at their maximum.
The outflow of water from Hamilton Inlet maintains lighter ice conditions throughout the winter. By the second half of April, open water predominates in this area but does not expand appreciably until after the middle of May. Breakup of Lake Melville usually starts in the third week of May and clears about 2 weeks later. Navigation into Lake Melville may require penetration of the offshore ice pack unless offshore winds create a lead along the coast from Battle Harbour to Groswater Bay. At this stage the ice pack tends to have very variable concentrations. The southern edge of the sea ice retreats to near latitude 55°N during the third week of June.
3.6.2.3 Ice features of the area
Ice growth along the east coast of Newfoundland is relatively insignificant compared to the heavier concentrations and wide variety of ice types that drift southward into this area.
The mean wind flow in the Strait of Belle Isle area is from the northwest during the winter, but in April this shifts to a predominant northeast wind. In periods when these northeast winds develop, some of the ice from the Labrador coast, in which we can find some old ice and icebergs, can be driven through the Strait of Belle Isle and into the Northeast Arm of the Gulf. Because this ice from the Labrador area is thicker than that formed locally, clearing in the Strait is slow when these intrusions occur.
Shore-fast ice is primarily confined to the area from Fogo Island to southern Notre Dame Bay. Some fast ice also forms in southern White Bay as well as the bays and harbours along the Northern Peninsula.
Offshore winds can spread the ice seaward, concentrations are lowered in the outer portions of the pack and shore leads can develop from White Bay to Cape Bauld and from Strait of Belle Isle northward to Hamilton Inlet. In these situations the pack streams southeastward from Cape Freels leaving the coast easily accessible from Cape Freels to Cape Race. On the other hand, onshore winds may narrow the open water lead considerably along the coast creating an ice hazard for navigation. In periods such as these the major bays of East Newfoundland become filled with pack ice, the approaches to St. John's may become congested and some ice may round Cape Race and drift towards the Burin Peninsula or even Saint-Pierre-et-Miquelon Islands.
Old ice can be embedded in the main ice pack and drift southward along the Labrador coast and can arrive off Hamilton Inlet in April. It does not reach significant proportions until May when the thinner ice is melting more rapidly and average concentrations are decreasing. In cold years however, when more ice is present, these old floes can have a serious effect on navigation. Old ice has persisted in the waters off southern Labrador until August.
3.6.2.4 Variability of total ice coverage
In general, the period exhibited normal to above normal conditions from 1982/83 to 1994/95 and then dropped to below normal conditions from 1995/96 to 2012/13. The most ice encountered in a single season in the Grand Banks for the period occurred in 1984/85; the least amount of ice occurred in 2009/10. The ice coverage varies considerably from year to year but in general, there were normal to above normal conditions from 1982/83 to 1994/95 then below normal conditions from 1995/96 to 2012/13.
3.6.3 Ice regime of the Labrador Coast
As spring temperatures rise, melting normally begins in southern Labrador waters around the end of April, reaching the Resolution Island area about mid-June. The pack slowly narrows and loosens, and the southern ice edge retreats from the Strait of Belle Isle to north of the approaches to Hamilton Inlet in June and the approaches to Hudson Strait and Frobisher Bay in July, although patches of ice may linger through August.
A small percentage of old ice is usually present within the Labrador pack. After all of the level first-year ice has melted at the end of the ice season, there is nothing but ridge remnants and old ice, and the latter may in fact be predominant. The offshore ice drifting in from Davis Strait may be over 150 centimetres thick. Many storms affect the area, and ice ridges up to 5 metres high can easily develop under pressure caused by winds and currents. As a rule of thumb, ice keels are in the order of 3 times the vertical extent of associated ice ridges. Westerly winds are frequent so a flaw lead develops, while along the outer edge the ice organizes into strips and patches. In periods of persistent east to northeast winds, the ice compacts near the coast and ice deformation processes can be very intense. Because of incoming swells and wave action the ice breaks up into small floes near the ice edge.
In December, first-year ice begins to appear off northern Labrador and new ice off southern Labrador. For the rest of the winter the pack is mostly first-year ice and an equilibrium edge establishes some 150 kilometres off the Labrador Coast. Ice condition comparisons between years can be largely related to the mean wind-flow experienced during the winter and spring months. Whenever low pressure weather systems persistently track across the Newfoundland area, easterly winds along the Labrador coast can compress all the ice into a 100 kilometres wide belt against the coast. However when the low pressure systems track north of the area, westerly winds spread the ice up to 500 kilometres seaward.
Freeze-up on the Labrador coast has started as early as the second half of October and as late as the second week of December. The Labrador coast has completely cleared of sea ice as early as the end of June but can persist until August.
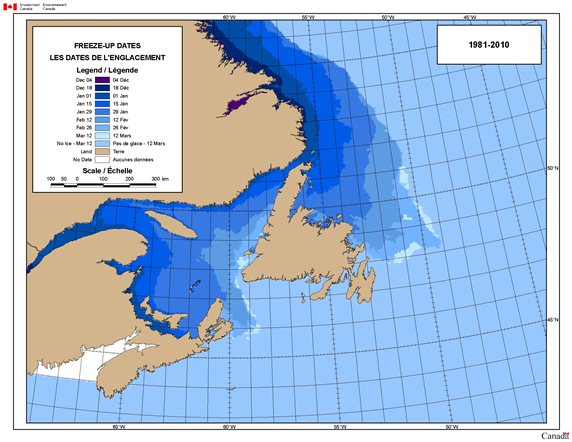
Figure 33 - Freeze-up dates on the East Coast (Chart courtesy of ECCC)
Text version: Freeze-up dates on the East Coast
A map of Canadian East Coast with shades that identify the common freeze-up dates for the winter between 1981 and 2010.
Legend:
- Dec 04 = Dark purple
- Dec 18 = Dark blue
- Jan 01 = marine blue
- Jan 15 = royal blue
- Jan 29 = blue
- Feb 12 = grey blue
- Feb 26 = soft blue
- Mar 12 = soft turquoise
- No ice - Mar 12 = soft grey blue
- Land = brown
- No data = white
A distance scale up to 300 km is provided to measure in increments of 50 and 100 km.
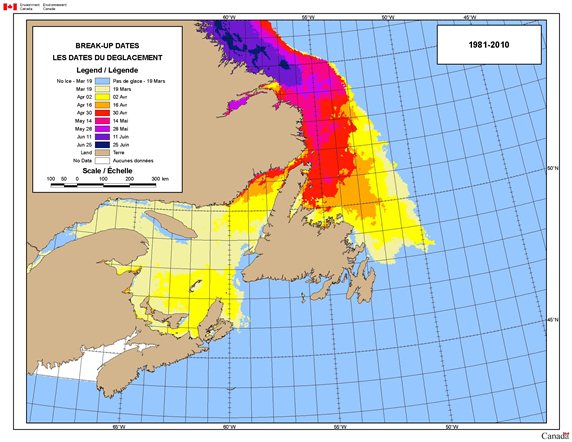
Figure 34 - Break-up dates on the East Coast (Chart courtesy of ECCC)
Text version: Break-up dates on the East Coast
A map of Canadian East Coast with shades that identify the common break-up dates for the spring between 1981 and 2010.
Legend:
- No ice - Mar 19 = soft blue
- Mar 19 = tan yellow
- Apr 02 = yellow
- Apr 16 = orange
- Apr 30 = red
- May 14 = pink
- May 28 = purple
- Jun 11 = purple blue
- Jun 25 = dark purple
- Land = brown
- No data = white
A distance scale up to 300 km is provided to measure in increments of 50 and 100 km.
3.7 Ice climatology for northern Canadian waters
In northern Canadian waters, ice is normally present in many areas throughout much of the year. In some sectors, much of the ice does not melt completely each year. Thus, for example, in the Arctic Ocean the differences between a typical chart showing the ice cover in summer and one in winter are the ice concentration and presence of openings in the pack and around the coastline. In the Canadian Arctic Archipelago, the period when air temperatures reach above freezing is very brief, so freeze-up can begin as early as August.
3.7.1 Meteorological influences
Sea ice forms largely as a result of removal of thermal energy from the sea and is lost principally by addition of thermal energy from solar radiation. Variations in these energy transfer processes are largely controlled by atmospheric events.
The most significant heat removal process is the evaporation of water into the atmosphere. Roughly, the rate of heat energy removal by the atmosphere is proportional to the difference in the temperatures of the water and the air over it, and also to the rate at which the water vapour can be removed from the interface, basically related to wind and atmospheric stability. In practice, the air temperature and knowledge of its changes can be used to estimate a date for beginning of ice formation. If there is a fairly complete ice cover, further thickening of the ice continues from radiation losses from the upper ice surface. Snow can accumulate on top of the ice and can provide insulation, reducing the loss of heat and so variations in the snow cover can have a significant effect on the growth in the thickness of the ice. In the absence of a snow cover, air temperature alone can be used to give a reasonable estimate of the thickening of the ice throughout the winter.
The ice is open to the action of winds and water currents as long as it is not stuck to the land, or “shore-fast.” Complex calculations can be done to estimate the dynamic interactions of the forces of air and water, as well as internal forces within the ice itself. For all practical purposes, free-floating ice will respond very quickly to any change in the water motion around it. On the other hand, the response by ice to the force of the wind takes time because of the great density difference between air and ice. The component of ice motion due to the wind is similar to the wind-driven current in situ – in fact open drift ice and the roughness of the ice surface can contribute to the development of a wind-driven current.
After ice forms along a coastline, cold seaward-moving winds often drift the ice farther away from the coast. The ice will either melt or continue to thicken, depending on whether heat energy is available in the water.
For most areas the ice coverage grows in the fall and early winter, reaching a limit where the thermal energy available in the oceanic water column does not permit further expansion. The ice conditions then remain much the same for several months, although there would be changes in the details.
In the spring, the main heat transfer process operating is radiation. The increasing height of the sun in the sky allows solar radiation to add heat energy to the water just as the intensity of cold air incursions and evaporative heat loss diminishes. Melting of the snow begins, and increasing incursions of warmer air allow a net positive balance in thermal energy at the surface. Puddles from the melting snow develop on the surface of the ice. The puddles are much more effective at capturing incoming short-wave radiation than ice and snow, hastening the melt process. Similarly, where there is open water, such as a polynya or a shore or flaw lead, there is also greatly enhanced absorption of incoming radiation. This warmed water moves with the tides and currents and the heat energy also transfers to the bottom surface of adjacent ice. Thus, polynyas act as centres around which the break-up process spreads. Once the ice has warmed up to the melting point, it too can begin to melt. The temperature of the ice and the water beneath it essentially remains at the melting point until the ice is gone. Also, as the ice warms up, it begins to shrink, and internal stresses develop within the ice. This process is amplified wherever there are discontinuities in the ice, and cracks and openings are created which can be acted on by waves, currents, winds and tides to initiate further break-up of the ice sheet.
3.7.2 Oceanographic factors
As noted under meteorological influences, ice can begin to form once sufficient thermal energy is removed from the water. How much cooling is necessary before ice can form depends on the characteristics of the water column. As long as the water being cooled at the surface is denser than the water below it, there will be upward mixing of warmer water, and ice does not form, barring exceptional circumstances.
Similarly, the ice melts if the wind pushes it into warmer waters. The ice cools the surface water then convective overturning in the water column brings warmer water back in contact with the ice, and melt continues. If ice incursions into the warmer water continue, and the water is shallow enough, the whole water column becomes cooled and a new edge will become established.
Tides and currents are important factors in the behaviour of sea ice and icebergs. Figure 35 shows the general circulation patterns in Canadian arctic waters. While the circulation patterns shown in these figures are relatively constant, at local or regional scales, the circulation may vary considerably. Because of the small (about 10%) difference in density between ice and water, ice will respond very quickly to a change in the current. Water movements near shore are strongly affected by tidal motions and surface water runoff variations, as well as local winds.
The principal driving force for the circulation of water is the North Atlantic current system. Dense and wind driven, the Gulf Stream and its extension, the North Atlantic Drift, moves vast quantities of water between Iceland and Scandinavia into the Arctic Basin. After circulating in the Arctic Ocean, most of this excess water exits the Arctic Ocean via the East Greenland current, aptly named, which also moves heavy Arctic pack ice southward between Greenland and Iceland. Much of this ice melts but some of it continues westward past Cape Farewell and then northward again in the north-flowing West Greenland Current before melting completely.
Some of this current turns westward in Davis Strait and some of it continues northward, into Baffin Bay, making a large counterclockwise gyre moving at about 10 to 20 kilometres per day. In northwestern Baffin Bay, this gyre is joined by almost all of the remaining volume of outflow from the Arctic Basin, which has filtered through amongst the islands of the Canadian Arctic Archipelago or through Nares Strait. The augmented southward flowing portion of the Baffin Bay gyre reaches Davis Strait, making as much as 20 to 30 kilometre per day and accepts some West Greenland waters as described above before becoming the Labrador Current. The main Labrador Current has 2 branches, the current from Baffin Island which is the most fresh and close to shore at about 10 kilometres per day, and the outer portion from West Greenland. At about 100 kilometres from the coast its rate is about 20 to 30 kilometre per day.
From northern Baffin Bay to southern Labrador Sea, the long term average ice motion may be generally described as following the shoreline at about 10 to 15 kilometre per day. Variations in wind speed may increase this motion or stop it entirely for short periods. If an average speed of 15 kilometres per day is maintained, multiyear ice off Devon Island at the beginning of October would arrive near the mouth of Hamilton Inlet about mid-February. This agrees with dates of aerial ice reconnaissance reporting older ice in the area.
Offshore to the northwest of the Canadian Arctic Archipelago, there is a slow, broad southward-setting current, which gradually turns westward across the northern portions of the Beaufort Sea. However within and adjacent to the Archipelago, it could be said that each major island or island group has a clockwise current around it. Because of the net transport southward through the Archipelago, and for dynamic reasons, the southward and eastward- portions of these currents are both broader and stronger than the other portions.
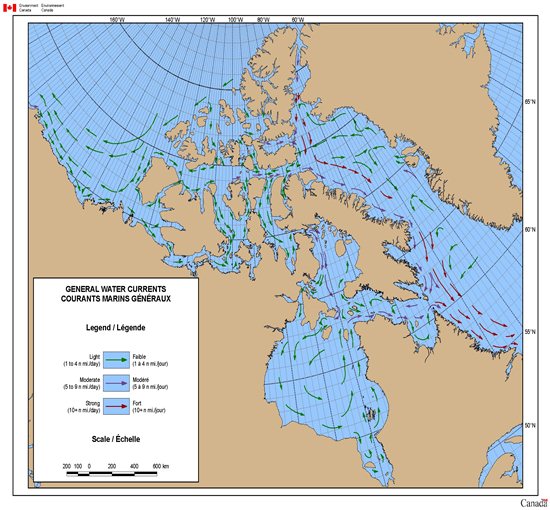
Figure 35 - General water currents in Northern waters (Chart courtesy of ECCC)
Text version: General water currents in Northern waters
A map of Canadian Arctic with mean water currents vectors. They identify the general directions and speed water bodies follow.
Legend:
- Light (currents of 1 to 4 nautical miles per day) = green arrows
- Moderate (5 to 9 nm/day) = charcoal arrows
- Strong (10+ nm/day) = red arrows
A distance scale up to 600 km is provided to measure in increments of 100 and 200 km.
In the shallow waters of Hudson Bay, there is a counterclockwise gyre, driven partly by winds, partly by runoff, which flows out along the south side of Hudson Strait and joins the inner section of the Labrador Current.
Along most coastlines, the ice can become attached to the land (shore fast) and can become extensive. However, the seaward extent of fast ice will be limited if tidal action is strong, and fast ice is generally within the shallower areas. Unless a body of water is very wide, or water motions strong, ice can form a continuous cover from shore to shore, such as amongst the islands of the Canadian Arctic Archipelago. In the broader or more dynamically active channels, the location of the edge of the shore fast ice can differ markedly from month to month and vary from year to year. In most of the channels the shore to shore fast ice breaks in the summer but the northern section of Nansen Sound remains fast for most years.
The Eastern Arctic is affected by tides with average daily ranges of 2 to 3 metres, although large ranges in excess of 6 metres are sometimes observed. Local anomalies may alter these ranges between high and low tides and may result in strong tidal currents in some areas. Narrow channels such as Hell Gate, Penny Strait and, to a lesser degree, Nares Strait and Byam Channel, are examples of this. Tides in the eastern Arctic are highest in the Hudson Strait and Iqaluit areas where Atlantic tides are felt. In the western and central Arctic, including most of the Queen Elizabeth Islands west of Resolute Bay, Arctic tides predominate. The Arctic Ocean, due to its polar location, has the lowest tidal range of any of the world's oceans. Here, average daily ranges are generally less than 1 metre.
In addition to affecting vessel operations, tides may result in intermittent pressure within an ice cover, affecting navigation. Table 7 illustrates the range in tides through the Canadian Arctic. Detailed tidal information for Arctic Island waterways is available in the latest edition of the CHS’s Canadian Tide and Current Tables.
Table 7 - Tidal ranges at selected Arctic locations
| Station | Location | Large range (metres) | Extreme range (metres) |
|---|---|---|---|
| Diana Bay | Ungava Bay | 10.2 | 10.8 |
| Churchill | Hudson Bay | 5.2 | 6.0 |
| Hall Beach | Foxe Basin | 1.3 | Not available |
| Iqaluit | S.E. Baffin Island | 11.6 | 12.6 |
| Nanisivik | N.W. Baffin Island | 2.8 | Not available |
| Resolute Bay | Cornwallis Island | 2.1 | 2.7 |
| Cambridge Bay | Victoria Island | 0.5 | 1.6 |
| Tuktoyaktuk | Beaufort Sea | 0.5 | 3.1 |
In some areas, particularly around the Beaufort Sea, storm surges affect sea levels as much as do tides. In ice-free summers, storm induced sea level increases of up to 1 metre are common, and may persist for several hours. In some embayments, such as Tuktoyaktuk Harbour, surge levels may exceed 2 metres. Tuktoyaktuk surge increases are associated with onshore winds, while temporary decreases in sea level occur in response to strong offshore winds. Negative surges can hinder vessel traffic in and out of Tuktoyaktuk Harbour because of relatively shallow water depths. Winter surges also occur in the Beaufort Sea but less frequently. However, even moderate high-water levels can force large pieces of ice onto beaches.
3.7.2.1 Topography and Bathymetry
The topography of the land has an impact on the ice since it affects the behaviour of surface winds, and in some cases even causes winds. During the colder season, over higher terrain or glaciers, very strong drainage winds can develop, affecting near shore ice. For certain atmospheric stability conditions, funneling can cause severe wind events, and in some cases even break up a consolidated ice area.
The continental shelf is the most significant single feature of the ocean bottom that affects Canadian ice regimes. Off eastern Canada the shelf extends out to about 300 kilometres off the coast abeam the Strait of Belle Isle and gradually narrows northward to 130 kilometres wide at approximately 56° N, and then expands to about 200 kilometres off Cape Chidley and Cape Dyer. A submerged ridge extends from the coast of Baffin Island to Greenland at about latitude 66° N. Seaward of this line, the deep waters provide a reservoir of heat energy which can readily reach the surface and melt any ice incursions.
Waters are fairly shallow in eastern Foxe Basin and in much of the western waterways. The continental shelf in the southern Beaufort Sea is 100 kilometres wide, except near Barter Island and Herschel Island where the shelf break is less than 50 kilometres from shore. Very shallow waters extend as much as 20 kilometres offshore and sea ice is often grounded. In the Canadian Arctic Archipelago, depths are generally in excess of 100 metres; however, the waters around King William Island are well known for being shallow.
3.7.2.2 Polynyas
A polynya is an irregularly shaped opening in the ice cover. Polynyas differ from leads in that they are not linear in shape. There are numerous polynyas in the Arctic that recur in the same position every year. Figure 39 shows the distribution of recurring polynyas in the Canadian Arctic.
The Arctic Archipelago region has three recurring polynyas: Hell Gate-Cardigan Strait, Dundas Island, and Bellot Strait. The Western Arctic has 1 area of recurring open water in winter, the Cape Bathurst polynya. Five polynyas exist in the Hudson Bay and Foxe Basin region. The one in southeastern Foxe Basin can disappear in adverse winds, however, the rest are present all winter. The Baffin Bay and Davis Strait area has 5 polynyas: a large polynya in Smith Sound (North Water), a small polynya in Lady Ann Strait at the entrance to Jones Sound, and others at the fast ice edge in Lancaster Sound, at the entrance to Cumberland Sound, and at the entrance to Frobisher Bay. To varying degrees, these polynyas are caused by winds, tide, currents, and bathymetry.
All the polynyas are influential in initiating fracturing and melt of the ice cover in the spring. The open water in polynyas absorbs heat, accelerating the decay of surrounding ice.
The polynyas also represent significant ecological areas as herds of marine mammals frequent these open water areas. For this reason alone, mariners should exercise caution while moving through polynyas.
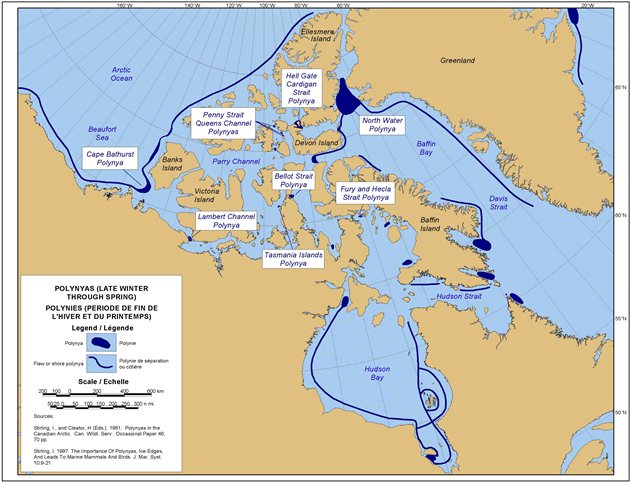
Figure 36 - Distribution of recurring polynyas in the Canadian Arctic (Chart courtesy of ECCC)
Text version: Distribution of recurring polynyas in the Canadian Arctic
A map of Canadian Arctic identifying the general polynyas' lines (i.e., currents creating open water lines and spots separating sea ice) from late winter to spring.
The principal polynyas are:
- Cape Bathurst
- Penny Strait - Queens Channel
- Lambert Channel
- Hell Gate - Cardigan Strait
- Bellot Strait
- Tasmania Islands
- North Water
- Fury and Hecla Strait
Legend:
- Polynya = dark blue spot
- Flaw or shore polynya = thick dark blue line
A distance scale up to 600 km is provided to measure in increments of 100 and 200 km. The scale is also converted into nautical miles.
Sources:
- Stirling, I., and Cleator, H (Eds.). 1961. Polynyas in the Canadian Arctic. Can. Wildl. Serv. Occasional Paper 46. 70pp.
- Stirling, I. 1997. The importance Of Polynyas, Ice Edges, And Leads To Marine Mammals And Birds. J. Mar. Syst. 10-9-21.
3.7.3 Ice regime of Northern Canada
3.7.3.1 Break-up
The following is a general description of the ice breakup season for a typical year. During the winter, frigid air masses develop over continental areas, then weather systems move the cold air over the adjacent seas. In spring, as the sun's elevation in the sky increases, and the land warms up, the cold winter blasts diminish rapidly in intensity. In southern portions, ice formation stops, but on average, winds continue to drift the existing ice towards warmer waters where convection in the water column can always bring a supply of warmer water to melt the ice. So the first signs of break-up appear in southern Labrador waters and in James Bay near the end of April. Break-up gradually spread northward during May and June.
At the same time in areas of consolidated ice, puddling of the melted snow cover begins while the thin ice in polynyas disappears. In June, decay has begun throughout the area. Because of absorption of solar heat by polynyas, particularly the North Water, and also the northwestern portions of Hudson Bay and Foxe Basin, decay and break-up also spread southward and eastward from these areas in June and July. At the end of the typical melt season, usually early September, high concentrations of ice are present in Nares Strait, Norwegian Bay, Queens Channel, Viscount Melville Sound, M'Clintock Channel and Victoria Strait. The Arctic Ocean pack lies 50 to 100 kilometres off the coast in the Beaufort. Also ice usually remains in Committee Bay and southern Gulf of Boothia.
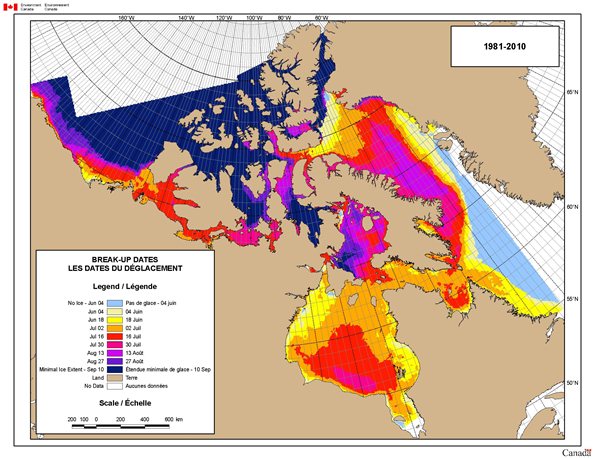
Figure 37 - Break-up dates in the Canadian Arctic (Chart courtesy of ECCC)
Text version: Break-up dates in the Canadian Arctic
A map of Canadian Arctic with shades that identify the common break-up dates for the summer between 1981 and 2010.
Legend:
- No ice - Jun 04 = soft blue
- Jun 04 = tan yellow
- Jun 18 = yellow
- Jul 02 = orange
- Jul 16 = red
- Jul 30 = pink
- Aug 13 = purple
- Aug 27 = purple blue
- Minimal Ice Extent - Sept 10 = dark purple
- Land = brown
- No data = white
A distance scale up to 600 km is provided to measure in increments of 100 and 200 km.
However, it is worth emphasizing that in many years, not all the ice will melt in other areas, notably Foxe Basin and northwestern Davis Strait. Only James Bay, the southern two thirds of Hudson Bay and the Labrador Sea always clear completely of sea ice.
3.7.3.2 Freeze-up
In August, summer comes swiftly to an end in the areas north of Parry Channel. Around the lingering floes from previous winters, new ice is able to form almost as soon as air temperatures drop below the freezing point. This new ice thickens rapidly so by early October, first-year ice from the new ice season is mixed with first-year ice remaining from the previous winter. On the 1st of October, first-year ice remaining from the previous winter is reclassified as second-year ice. It will be nearly salt free, and much harder than the recently formed ice. In December, the first-year ice normally becomes a consolidated sheet with embedded multi-year and second year ice. This old ice is often predominant in the Canadian Arctic Archipelago except around Baffin Island. The rest of the area becomes encumbered with ice moving with weather systems and currents, except for offshore portions of the Labrador Sea.
Fast ice becomes well established along the Baffin Island, Greenland and Labrador coasts. The width of this fast ice may reach 50 kilometres at times in some areas. Offshore, the pack remains mobile throughout the winter and floes ranging from small to vast in size are repeatedly frozen together and broken apart.
Arctic sea ice carried by the east Greenland current rounds Cape Farewell (southern tip of Greenland) in January, reaches its maximum extent near 63°N in May, but disappears from waters west of Cape Farewell in August. This sea ice is normally located within 100 kilometres of the Greenland coast.
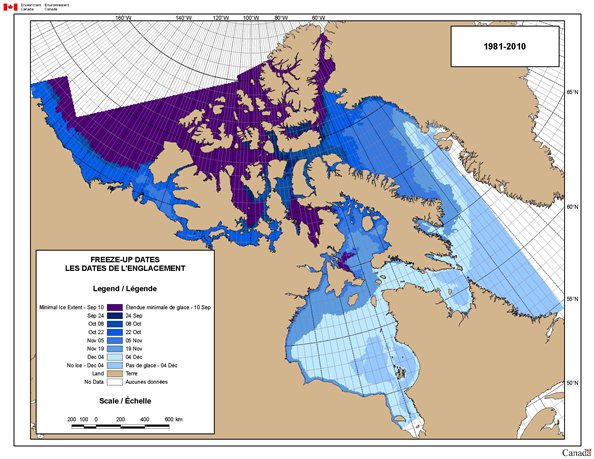
Figure 38 - Freeze-up dates in the Canadian Arctic (Chart courtesy of ECCC)
Text version: Freeze-up dates in the Canadian Arctic
A map of Canadian Arctic with shades that identify the common freeze-up dates for the fall between 1981 and 2010.
Legend:
- Minimal Ice Extent - Sep 10 = dark purple
- Sep 24 = dark blue
- Oct 08 = marine blue
- Oct 22 = royal blue
- Nov 05 = blue
- Nov 19 = grey blue
- Dec 04 = soft turquoise
- No ice - Dec 04 = soft blue
- Land = brown
- No data = white
A distance scale up to 600 km is provided to measure in increments of 100 and 200 km.
3.7.3.3 Variations
Wide variations in ice conditions can occur from one year to the next for the same date, and in some areas, from week to week. Furthermore, the entire nature of the ice cover may differ from year to year. For example, Amundsen Gulf ice remains light and mobile in some years: in others it consolidates, sometimes with embedded old ice. A warm summer in the High Arctic results in greater old ice break-up in the Sverdrup Basin, giving heavier ice the following spring and summer in Parry Channel. Parry Channel consistently develops a consolidated ice cover in western Barrow Strait, but the eastern edge may lie at Bylot Island or at Somerset Island or most anywhere in between, and break up and re-form more than once during the winter season. Similar variations occur in the timing of consolidation in Nares Strait, but the extent of consolidation there is remarkably consistent. The width of the pack off Labrador and in Davis Strait is sensitive to extended periods of on-shore or off-shore winds.
3.7.3.4 Ice thickness
During the course of a single winter in northern portions of the Canadian Arctic Archipelago, undisturbed bare ice can grow to a maximum of about 240 centimetres. In the central and western Arctic, maximum thickness is about 200 centimetres. Farther south, in James Bay and along the Labrador coast, the thickness of locally developed ice can reach about 120 centimetres.
Multi-year ice found in the Archipelago reaches a thickness of 300 to 450 centimetres. However ice shelf fragments can be as thick as 2000 centimetres. The ice shelves consist of fresh-water and sea-water ice, formed over many years along the northwestern shore of Ellesmere Island. Some pieces of the shelf there have broken off in recent years, and these very distinctive ice features are occasionally found far from their point of origin. They are much like tabular icebergs, except not formed from snow.
3.7.3.5 Old ice
The presence of old floes within an area of predominantly first-year ice has a direct impact on the penetrability of an ice area even for the most powerful vessels.
In September, there may be some old ice present from earlier years, some first-year ice from the previous winter, which has failed to melt, and also recently formed ice, which is at the first-year stage of development by the end of the month. Although second and multi-year ice are difficult to identify separately at any time, it is useful to separate these 3 ice types which have different hardness. For this reason any first-year ice which survives to October 1st is promoted to second-year ice on that date. Thus, there is an increase in the amount of old ice in the October charts due to this promotion.
In May, the median concentration of old ice indicates an elongated area of 1 to 3 tenths of old ice in south-western Baffin Bay extending southward to western Davis Strait. This pattern doesn’t change much through June to mid-July. This old ice melts after mid-July and the area is for the most part free of old ice in August through the fall.
At first, one might think that increasing old ice amounts during the melt season is not correct, but what occurs here is a melting of the thinner forms of ice, allowing the old floes to accumulate in an area rather than being dispersed through the pack.
In Foxe Basin, the median amount of old ice never rises above zero except in the Igloolik to Fury and Hecla Strait area, but it is evident from our climate data that old floes do infest many sectors of the Basin. The increase in the frequency of old ice in October (but not its amount) identifies areas where clearing did not occur by the end of September.
Both the amounts and frequency of occurrence of old ice are notable in southern Gulf of Boothia and Committee Bay, as well as in M'Clintock Channel, Larsen Sound and Victoria Strait.
The median old ice concentration in western Barrow Strait lies in the one to three tenths range, but bumps up to the four to six tenths range with the October 1st ice promotion.
In Sverdrup Basin, old ice is usually predominant. However in warm summers, break-up can leave large areas where first year ice will predominate in the following year. In Norwegian Bay, old ice concentrations and frequencies are lower in eastern sections, as low as the one to three tenths range. In Eureka sound, small amounts of old ice usually persist through the melt season.
In the Beaufort Sea the Arctic Pack of the Arctic Ocean is a dominating feature. As might be expected, both the amount and frequency of occurrence of old ice increases with the distance from the coast. Except within the shallows of the Mackenzie Delta there is always a small percentage frequency of old ice. In fact, as the first-year pack near the coast melts out in the summer, incursions of old ice increase the percentages near the coast.
3.7.4 Ice regime of Hudson Bay
Ice melt starts in May, as an open water area develops along the northwestern shore, and a narrow coastal lead develops around the rest of the Bay. In June and July, open water leads expand around the shoreline so that at the end of July, only large patches remain in southern portions of the Bay. In August the last vestiges disappear. Intrusions of ice from Foxe Basin may occur in the northeastern part of the bay in some years.
In late October, the ice begins to form along the northwestern shores of the Bay. Some years there may also be a simultaneous development in the cold waters near Foxe Channel. In November, the ice thickens as prevailing winds move it east and southeast. In December the Bay becomes covered with thickening first-year ice.
During the winter, a 10 to 15 kilometres wide fringe of shore-fast ice develops along most of the coastline and in many years a distinctive consolidated ice area develops between the Belcher islands and the Quebec coast. Meanwhile, the pack responds to winds and the slow counter clockwise current gyre in the bay.
In Hudson Bay, freeze-up has commenced as early as the first week of October and as late as the first week of November, while complete melting has occurred as early as mid- July and as late as the first week of September, except for incursions from Foxe Basin.
3.7.5 Ice regime of James Bay
Ice melt begins in late April. By mid-July much of the bay is open water. Complete clearing normally occurs in early August but the northwest portion may receive occasional intrusions of ice from Hudson Bay until late August. Freeze-up is usually quick beginning after mid November. However, freeze-up has begun as early as the first week of November and as late as early December. Complete clearing has occurred as early as late June and as late as late August.
James Bay ice is noted for its discoloration, caused by freezing of shallow muddy water, or by run-off concentrating sediments on the surface of the ice. A sizable open water area often develops south of Akimiski Island. Old ice does not reach James Bay.
3.7.6 Ice regime of Foxe Basin
Ice normally forms in northern and western portions near mid-October, thickening rapidly and spreading southward and seaward to cover the Basin and Foxe Channel early in November. The ice becomes predominantly first-year ice by December.
Melting starts by June. The polynya near Hall Beach slowly enlarges. Open water leads expand around the shoreline in July. In the central Basin, the ice very gradually decreases in amount but more rapid disintegration occurs in August. Patches of ice persist during September.
In Foxe Basin shallow water combines with large tidal ranges and strong winds to keep a large amount of bottom sediments in suspension. Thus the ice is very rough, much of it in small floes and muddy in appearance. In northern and southwestern sectors there are large areas of shore-fast ice. In some years, all the ice will melt throughout Foxe Basin and Foxe Channel, while in other years with a cold summer, significant concentrations of ice will remain as freeze-up begins again. Thus second year ice may affect Foxe Basin and adjacent waters through the following winter and spring.
In Foxe Basin, freeze-up has started as early as late September and as late as the third week of October. Complete clearing does not occur every year but has occurred as early as the first week of September.
3.7.7 Ice regime of Hudson Strait and Ungava Bay
Freeze-up usually begins near the shore in western Hudson strait in November, then ice formation progresses to cover the entire area by early December, and by mid-December the first-year stage predominates. Except for quite extensive shore-fast ice among the islands from Big Island to Cape Dorset, the ice is in constant motion because of strong currents and frequent gale force winds. Ridging, rafting and hummocking are continually taking place, and ice congestion often affects Ungava Bay and the south side of Hudson Strait. Conversely, a shore or flaw lead is frequently present on the north side of the Strait. At times small concentrations of second year ice drift into the area from Foxe Basin. Multi-year ice also enters eastern portions from Davis Strait.
Open water leads develop in May, slowly expand in June. Clearing becomes extensive during July but Ungava Bay often remains encumbered with heavy deformed ice, with some embedded old ice in July. Complete clearing has taken place as early as mid-July and as late as the end of August. However it is worth noting that incursions of second year ice from Foxe Channel occur in some years. Figure 39 is a composite ice chart for 16 May 2011, compiled by CIS, showing the extent of the fast and mobile ice areas in Hudson Bay and Strait.

Figure 39 - Example of a regional ice chart for Hudson Bay and Hudson Strait (Chart courtesy of CIS)
Text version: Example of a regional ice chart for Hudson Bay and Hudson Strait
From the Canadian Ice Service (Environment and Climate Change Canada), an example of a daily regional ice chart (lower Arctic) that represents polygons coloured to ice concentrations. Each polygon is bound to an egg code identifying numbers associated with concentrations, stage of development and floe size.
Title: Regional Ice Analysis, Hudson Bay
Date: 16 May 2011
A small legend is provided for the mean and normal temperatures of the past 7 days for:
- Iqaluit = -6.9C / -5.2C
- Coral Harbour = -9.0C / -7.6C
- Churchill = -0.9C / -1.4C
- Moosonee = 7.4C / 5.3C
- Inukjuak = -2.4C / -2.3C
- Kuujjuaq = -0.7C / -0.4C
- Nain = 1.9C / 0.5C
Legend for the World Meteorological Organization (WMO) Colour Code - Concentration:
- Ice Free = white with grey lines in sets of 3.
- Less than 1/10 = soft blue
- 1-3/10 = soft green
- 4-6/10 = yellow
- 7-8/10 = orange
- 9-10/10 = red
- Fast Ice = charcoal
- Undefined = white with question marks
- New Ice = soft pink
- Nilas/Grey Ice = pink
In Hudson Strait, freeze-up has started as early as mid-October and as late as the first week of December, while complete clearing has occurred as early as late July and as late as early September. Freeze-up in Ungava Bay has begun as early as late October and has been delayed until the second week of December.
3.7.8 Ice regime of Baffin Bay and Davis Strait
In late May and June, any thin ice in the North Water polynya in northern Baffin Bay disintegrates, and then clearing extends southward across the approach to Lancaster Sound. The pack deteriorates more quickly around the eastern shores than it does in the centre of the bay. Thus at the beginning of August ice remains near the coast from Cape Dyer to Clyde River and in central parts of the Bay northward to near latitude 74°N. The pack is finally reduced to offshore patches between Cape Dyer and Home Bay late in August. Clearing occurs on the average by late August.
The north-flowing current along the Greenland coast is relatively warm, and the south-flowing current along the east Baffin Island is relatively cold. Thus ice formation along the west side of the Bay begins earlier than on the Greenland side. In September, new ice begins to form in the northwestern reaches of Baffin Bay. By the end of the month a fringe forms all along the Baffin Island coast. Ice formation accelerates through October and November, such that first-year ice becomes predominant north of Cape Dyer near mid-November. On average, the southern extent of sea ice achieves equilibrium near a line from the Greenland Coast near latitude 68°N generally southwestward to a point some 200 kilometres off Resolution Island.
First-year ice predominates in Baffin Bay and Davis Strait throughout the winter. Because an area of low pressure is often centered in Baffin Bay, winds may develop a flaw lead along the Baffin Island coast. A percentage of multi-year ice originating mainly from Smith Sound and sometimes Lancaster Sound infests the western side. This ice is mostly in the range of 240 to 320 centimetres thick. Ridging, rafting and hummocking are significant, and icebergs abound.
Warning: High volumes of old ice in northern Baffin Bay pose a significant risk to shipping.
An open water route across northern Baffin Bay has occurred as early as the third week of June and has been as late as the last week of August. Frobisher Bay has cleared of sea ice as early as late June and as late as early October. Baffin Bay and Davis Strait have cleared of all sea ice as early as mid-August, in other years some ice has remained until freeze-up began. In the latter situation the floes remaining are usually well dispersed throughout the area by autumn storms. Freeze-up in northwestern Baffin Bay has developed as early as the last week of August and been delayed until the middle of October. In Frobisher Bay, new ice formation has begun as early as mid-October, and as late as the second week of November.
3.7.9 Ice regime of the Arctic Archipelago
As temperatures move above freezing in the high Arctic, polynyas and open areas start to expand slowly. Then during June, the mobile ice in Lancaster Sound clears from the west followed by break-up of its consolidated ice. On the consolidated ice in the Archipelago, puddling begins, becoming extensive in early July. Fracturing in much of the Archipelago usually occurs in July, but often waits until August in Barrow Strait, Norwegian Bay, Viscount Melville Sound, Peel Sound, Larsen Sound and M'Clintock Channel.
In Dolphin and Union Strait, Coronation Gulf and Dease Strait clearing usually comes before the end of July. Complete clearing in Admiralty Inlet and in Pond Inlet usually occurs in early August and in Queen Maud Gulf and south and east of King William Island during the second week of August. Wellington Channel and Jones Sound normally clear by late August, but incursions from the north may occur. Peel Sound, Prince Regent Inlet and the Gulf of Boothia will often clear in early September. However, the southern end of the Gulf of Boothia as well as Committee Bay usually remains encumbered with old ice throughout the summer. In Sverdrup Basin, the area of fracturing is quite variable, and ice is usually present as freeze-up begins in the fall.
In Parry Channel, and in central portions of the Archipelago, new ice begins to form in September, and thickens rapidly to first-year ice in October, and then most of the area consolidates. However, in Lancaster Sound, freeze-up events may be delayed by a month because of strong winds and tidal activity. New ice begins to form around King William Island during the first week of October, consolidating in early November. Freeze-up spreads to Coronation Gulf, and consolidation is usually complete in mid-November.
In central portions of Viscount Melville Sound, and M'Clintock Channel the ice may remain in restricted motion during December. Small tidal openings are common in Penny Strait and Bellot Strait while a significant polynya exists in Hell Gate all winter. In eastern Parry Channel, the rate of consolidation varies considerably from year to year. Some years, consolidation reaches almost to the eastern entrance to Lancaster Sound, while in other years, consolidation only reaches Barrow Strait, but the median consolidation edge is at Prince Leopold Island.
East and south of a line from King William Island to Bathurst Island to southern Ellesmere Island, first-year ice predominates, with a small percentage of multi-year ice floes here and there. Committee Bay is an exception, where much of the ice is of the multi-year variety. West and north of this line, the predominant ice type is multi-year and the concentration of first-year ice depends upon the extent of break-up during the previous melting season.
The area of Larsen Sound and surrounding waters, and also the Committee Bay area noted above acts as a trap for old ice that periodically invades from more northern areas, because there is no effective exit for the ice. Incoming heat energy during the summer is sufficient to reduce the thickness of the old floes by more than the normal winter growth of this ice. The cycle may take several years before melt of an old floe is complete, but a “new” supply of old ice invades the area every few years.
Ice conditions can vary greatly from one year to the next. During colder winters, Lancaster Sound and Prince Regent Inlet can develop a consolidated ice cover and Lancaster Sound may still have loose ice as freeze-up begins. During easy years, Lancaster Sound can become bergy water by the end of May and remain open until new ice forms in October.
During colder summers, many of the channels remain consolidated, or retain close pack ice leading to early freeze-up. On the other hand, during a warmer summer, most channels break up, with extensive clearing ensuing. This may allow old ice broken from the ice cover in the Queen Elizabeth Islands to drift south in the fall into Parry Channel, contributing to difficult ice conditions there the following year.
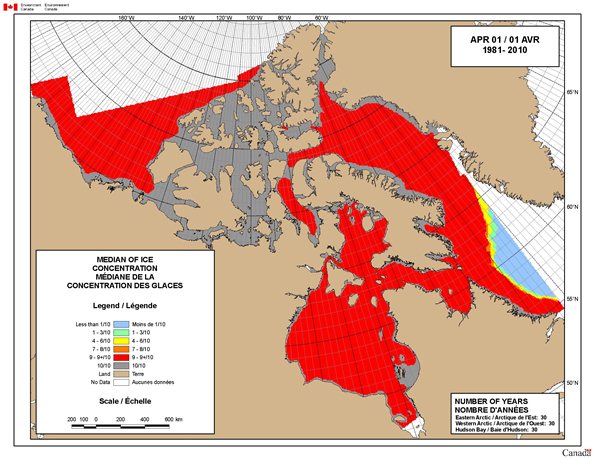
Figure 40 - Median of ice concentration in the Canadian Arctic (Chart courtesy of ECCC)
Text version: Median of ice concentration in the Canadian Arctic
A map of Canadian Arctic identifying the median of ice concentration on April 1st between 1981 and 2010.
Legend:
- Less than 1/10 = soft blue
- 1-3/10 = soft green
- 4-6/10 = yellow
- 7-8/10 = orange
- 9-9+/10 = red
- 10/10 = charcoal
- Land = brown
- No data = white
Note for Number Of Years:
- Eastern Arctic = 30
- Western Arctic = 30
- Hudson Bay = 30
A distance scale up to 600 km is provided to measure in increments of 100 and 200 km.
3.7.10 Ice regime of the Beaufort Sea
Old or multi-year ice up to 450 centimetres thick - the Arctic Pack - continuously circulates with currents and winds in the Arctic Ocean, and it is present year round. Its degree of penetration into the Beaufort Sea at any given time is dependent on the wind regime of the year. On average, the boundary of the Arctic Pack lies from near Cape Prince Alfred southwestward to some 200 kilometres north of Herschel Island and then westward some 200 kilometres off the Alaska North Coast. Between the Arctic Pack and the coastal shore-fast ice, mobile first year ice is predominant through the winter.
The edge of consolidation in Amundsen Gulf can be quite different from year to year, but commonly it lies near Cape Baring or Cape Lambton, or less frequently at Cape Kellett. In spring, northwest winds die off, and east and southeast winds become predominant, so that a polynya develops there.

Figure 41 - Spring extent of sea ice in the Beaufort Sea (Chart courtesy of ECCC)
Text version: Spring extent of sea ice in the Beaufort Sea
A map of Western Arctic identifying the median of ice concentration on April 1st between 1981 and 2010.
Legend:
- Less than 1/10 = soft blue
- 1-3/10 = soft green
- 4-6/10 = yellow
- 7-8/10 = orange
- 9-9+/10 = red
- 10/10 = charcoal
- Land = brown
- No data = white
Note for Number Of Years:
- Western Arctic = 30
A distance scale up to 300 km is provided to measure in increments of 50 and 100 km.
In June, melt begins in the Mackenzie Delta and an open water area also develops quickly. Typically, Amundsen Gulf fractures in late June and the ice drifts out and decays. The fast ice along the Tuktoyaktuk Peninsula fractures in late June or early July, and by the end July an open water route usually develops from Mackenzie Bay to Cape Bathurst. Amundsen Gulf usually clears before August.
West of the Mackenzie Delta to Point Barrow, a narrow shore or flaw lead develops in July. Open drift ice conditions do not develop along the coast until the first week of August and an open water route not until the first week of September.
Freeze-up in the Beaufort depends to a very great extent upon the location of the southern limit of the Arctic Pack. New ice formation starts among the multi-year floes in late September and spreads southward while it also spreads seaward from the coast.
By late October much of the ice is at the first-year stage right out to the Arctic Pack. Shore-fast ice is extensive and grows seaward to the vicinity of the 20 metre water depth. Onshore winds during the winter months hold the mobile pack ice tight to shore-fast ice.
During a cold summer, the shore-fast ice along the Tuktoyaktuk peninsula may not completely break until mid-July. These cold summers occur when northwesterly winds keep the Arctic Pack close to shore. Open water along the Alaskan coast can develop as early as the third week of July.
Table 8 indicates when the extent and concentration of ice for different regions was at its record high or record low. In the north, the statistics for the season are from June 25th to October 15th. In the south, the season begins in the fall when the ice first forms, and continues into the following spring or early summer when the ice melts.
Table 8 - Minimum and maximum ice seasons
| Region name | Season of minimum ice coverage | Season of maximum ice coverage |
|---|---|---|
| Northern Canadian waters | 2012 | 1983 |
| Canadian Arctic | 2012 | 1972 |
| Northwest Passage (southern route) | 2012 | 1978 |
| Beaufort Sea | 2012 | 1969 |
| Gulf of St. Lawrence | 2009-2010 | 2002-2003 |
| East Newfoundland waters | 2009-2010 | 1989-1990 |
| Lake Ontario | 2001-2002 | 1978-1979 |
| Lake Erie | 1997-1998 | 1977-1978 |
| Lake Michigan | 2001-2002 | 1976-1977 |
| Lake Huron | 2011-2012 | 1993-1994 |
| Lake Superior | 2011-2012 | 1995-1996 |
- Date modified: