
Archived - Icebreaker Requirements 2017-2022
4. Icebreaking clients
2023-2028 Client Icebreaking Requirements replaces this content.
Table of Contents
- Introduction
- Background
- Icebreaking services
- Icebreaking clients
- Industry requirements
- Planned icebreaker deployment
- Conclusion
- Appendices
Marine transportation is the most cost effective method to transport goods and is more environmentally friendly than any other mode of transportation for the delivery of Canadian goods. In 2010, marine transportation could move cargo 24% farther (or was 24% more fuel-efficient) than rail and 531% farther (or was 531% more efficient) than truck. By 2017 when new regulations will be in place for truck, rail and marine, marine transportation is expected to move cargo 74% farther (or will be 74% more fuel-efficient) than rail and 704% farther (or will be 704% more efficient) than truck Footnote 2. Consequently, the quantities of atmospheric pollutants emitted by marine transportation, including greenhouse gases, are less than those produced by other modes when expressed per tonne-kilometre. Canada’s greenhouse gas emissions in 2012 for domestic navigation were 5,800 ktCO2, compared to heavy duty vehicles at 41,700 ktCO2, and railways at 7,600 ktCO2 Footnote 3. During the winter, ice-covered ports such as Montreal, Corner Brook and Bécancour rely on icebreaking services for their economic viability and stability. Ice management for flood control prevents millions of dollars in property damage along the St. Lawrence River. In the Arctic, cargo vessels and tankers resupplying Northern communities depend upon icebreakers for route assistance in order to access the ports in the delivery of essential fuel and goods.
The need for icebreaker support has changed over the last decade. Marine traffic levels have evolved with an increase in the number of efficient, ice-capable vessels, and additional year-round ferries. In 2014-15 ferry escort used approximately 20% of icebreaking resources compared to 10% in 1998. The St. Lawrence Seaway Management Corporation is requesting earlier opening of the Great Lakes corridors. Climate change may result in shorter ice seasons, but could also result in pack ice migrating from the Arctic on the North East Coast of Newfoundland, as was the case in 2017; significantly impacting marine navigation and the fishing industry in the area. In the upcoming years variability and unpredictability are expected to continue and to create challenging situations.
Since the Icebreaker Requirements (2011-2016) was developed, the fleet capacity has decreased by one vessel. As the Agency balances service delivery with required maintenance and vessel life extensions, one or two icebreaking vessels will need to be removed from service for extended periods of time each year until 2021-22.
The Canadian Coast Guard has also focussed on improvements in the provision of high-quality ice information and recommended ice routes to mariners as well as new technologies for monitoring ice conditions in real-time on the St. Lawrence River, for modeling ice conditions on the East Coast and in new navigation equipment for vessels operating in ice. Together, these technical and technological improvements have contributed to reduce the demands for escorts.
Another significant influence is an increase in demand for icebreaker support in the Arctic. Recent Government of Canada funding from the Oceans Protection Plan will expand the duration of icebreaking operations, adding a week at the beginning and the end of the season if required and if possible.
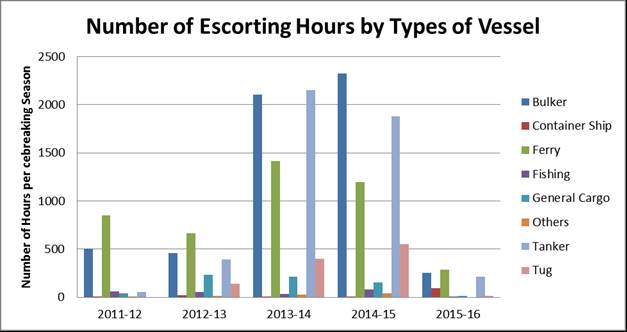
The following Figure indicates the number and type of vessels escorted by Canadian Coast Guard in ice-covered waters in Southern Canada, extracted from the Canadian Coast Guard IODIS database. The years with a higher number of escort requests reflect the harsher weather conditions.
Figure 1: Number of escort hours per ice season (December to May), by vessel type, in southern Canada
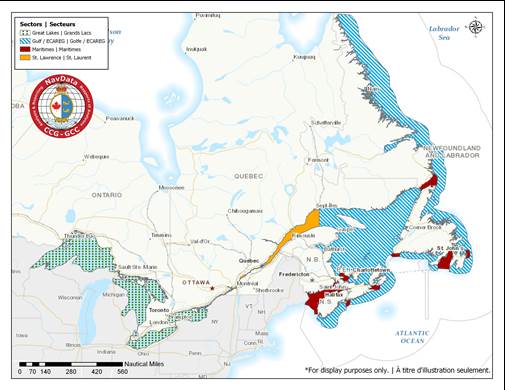
Data in Figure 2 is extracted from the INNAV system and indicates the number of trips within southern Central and Arctic, and Eastern regions which includes all of the ports within the: Great Lakes (including the US), St. Lawrence, Maritimes and Newfoundland. The map in Figure 3 identifies the four sectors. For a vessel transiting from the East Coast to Montreal for example, it will be recorded in three sectors. Therefore, adding all trips in the graph would not be representative of the total number of trips.
The detailed chart of maritime traffic during the ice season by type of vessel can be found in Annex E.
Figure 2: Maritime traffic during ice season (December to May) in southern Canada, by sector

Figure 3: Map of the sectors
Maps for each year from 2011-2017 can be found in Annex F showing ice conditions and traffic in southern Canada during the winter months and in the Arctic during the summer months.
- Date modified: